EMC concepts explained
Impact of Decoupling Capacitors and Trace Length on Conducted Emissions in a CMOS Inverter Circuit
T

he impact of decoupling capacitors and a PCB trace length on signal integrity was discussed in [1], while the impact on radiated emissions was discussed in [2]. In this article, we evaluate the impact of the capacitors and trace length on conducted emissions.

1. CMOS Inverter Circuit
Figure 1 shows the block diagram of the inverter circuit and the PCB. In this study, trace length varied between 3,000 mils (short trace) and 20,000 mils (long trace). Additionally, the PCB was tested in two configurations: without the decoupling capacitors and with decoupling capacitors by each inverter (0.1 µF and 1 µF).
2. Conducted Emissions Measurement Setup
The measurement setup is shown in Figure 2. The measurements were performed in a semi-anechoic chamber, in accordance with CISPR 25 Edition 5 automotive standard.

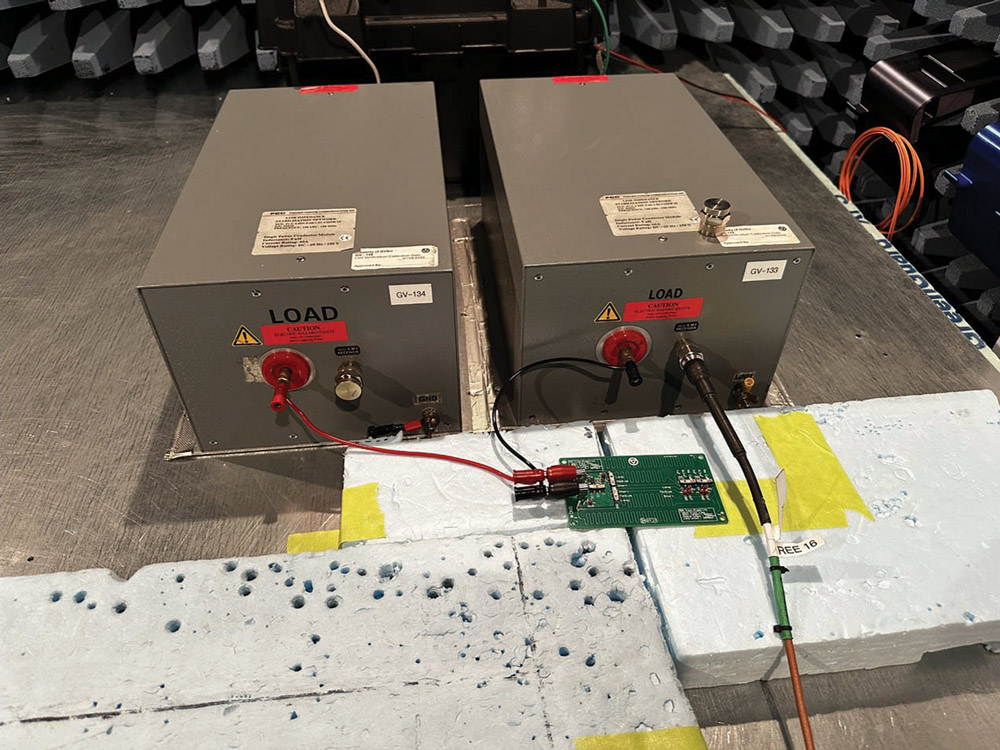
Measurements were taken on both the battery and ground lines, in the frequency range 150 kHz – 108 MHz. In the frequency range 150 kHz – 30 MHz measurements were taken with a bandwidth of 9 kHz while in the range 30 MHz – 108 MHz the bandwidth was set to 120 kHz. All measurements were taken with the average, peak and quasi-peak detectors.

Figure 1: Block diagram of the inverter circuit and the PCB
Figure 2: Measurement setup
3. Impact of the Trace Length on Conducted Emissions
In this section, we evaluate the conducted emission results from the PCB with short traces (3,000 mils) and long traces (20,000 mils) without decoupling capacitors by the inverters.
3A. Short trace vs. long trace: 150 kHz – 30 MHz
Conducted emission results are shown in Figure 3 (battery line) and Figure 4 (ground line).
Observations
Both short and long trace showed failures at the same frequencies, on both the battery and ground lines. The failures for the short trace were smaller.
Figure 3: Battery line, 150 kHz – 30 MHz: a) short trace b) long trace
Figure 4: Ground line, 150 kHz – 30 MHz: a) short trace b) long trace
3B. Short trace vs. long trace: 30 MHz – 108 MHz
Conducted emission results are shown in Figure 5 (battery line) and Figure 6 (ground line).
Observations
Both traces showed failures over the entire frequency region, with one trace outperforming the other in three frequency subregions.

30 – 42 MHz: Short trace outperformed the long trace, on both the battery and ground lines, using both detectors.

44 – 88 MHz: Long trace outperformed the short trace, on both the battery and ground lines, using both detectors.

90 – 108 MHz: Short trace outperformed the long trace, on both the battery and ground lines, using both detectors.

Figure 5: Battery line, 30 MHz – 108 MHz: a) short trace b) long trace
Figure 6: Ground line, 30 MHz – 108 MHz: a) short trace b) long trace
4. Impact of the Decoupling Capacitors on Conducted Emissions – Short Trace
In this section, we evaluate the conducted emission results from the PCB with short traces, without the decoupling capacitors, and with the decoupling capacitors by each inverter (0.1 µF and 1 µF).
4A: Short trace with and without decoupling capacitors: 150 kHz – 30 MHz
Conducted emission results are shown in Figure 7 (no caps) and Figure 8 (caps).
Observations
Battery Line: Capacitors eliminated the failure at 6.04 MHz. At 26.17 MHz, quasi-peak failure was eliminated and the average detector failure was substantially reduced.

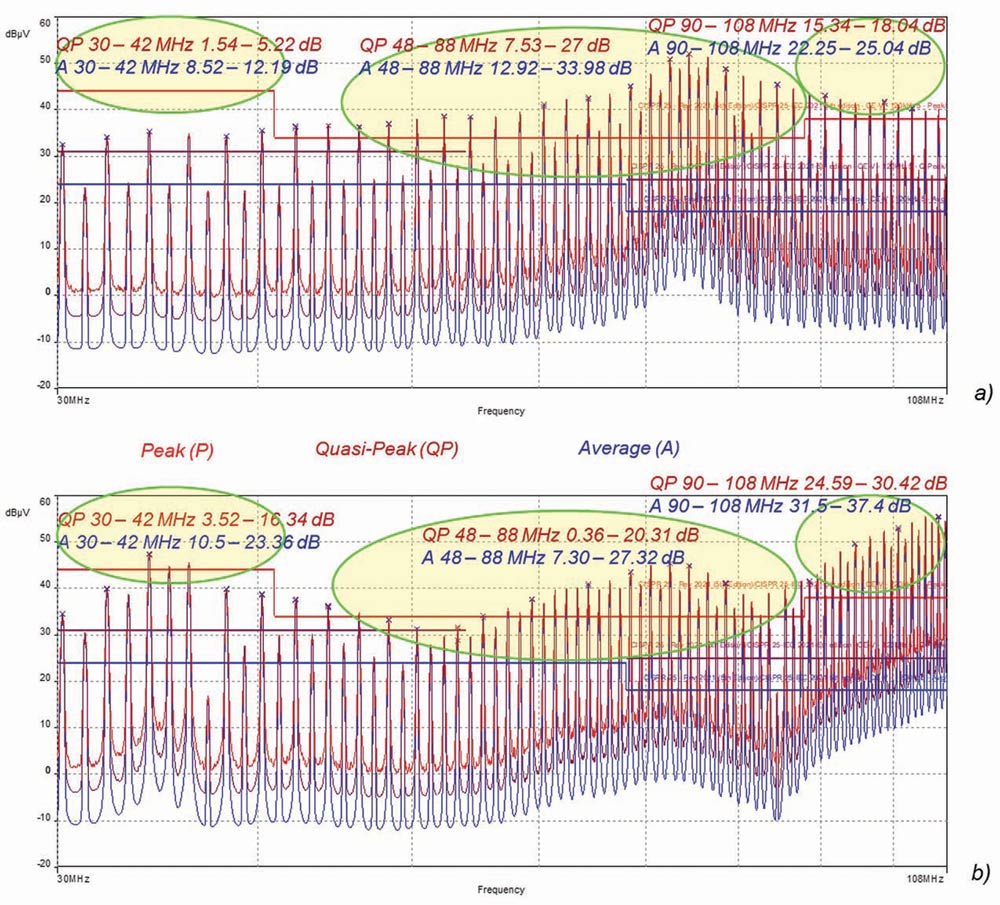
Ground Line: Capacitors eliminated the failures at 6.04 MHz and 26.17 MHz.

Figure 7: Battery line, 150 kHz – 30 MHz: a) without capacitors b) with capacitors
Figure 8: Ground line, 150 kHz – 30 MHz: a) without capacitors b) with capacitors
4B. Short trace with and without decoupling capacitors: 30 MHz – 108 MHz
Conducted emission results are shown in Figure 9 (no caps) and Figure 10 (caps).
Observations
Battery Line: Capacitors eliminated the quasi-peak failures over the entire frequency range except for a single substantially reduced failure, at 107.73 MHz. The average detector failures were eliminated up to the frequency of 73 MHz, and the failures in the range 73 – 108 MHz were substantially reduced.

Ground Line: Capacitors eliminated the quasi-peak failures up to the frequency of 87 MHz, and the failures in the range 87 – 108 MHz were substantially reduced. The average detector failures were eliminated up to the frequency of 73 MHz, and the failures in the range 73 – 108 MHz were substantially reduced.

Figure 9: Battery line, 30 MHz – 108 MHz: a) without capacitors, b) with capacitors
Figure 10: Ground line, 30 MHz – 108 MHz: a) without capacitors, b) with capacitors
References
  1. Bogdan Adamczyk and Mathew Yerian-French, “Impact of a Decoupling Capacitor and Trace Length on Signal Integrity in a CMOS Inverter Circuit,” In Compliance Magazine, January 2024.
  2. Bogdan Adamczyk and Mathew Yerian-French, “Impact of a Decoupling Capacitor and Trace Length on Radiated Emissions in a CMOS Inverter Circuit,” In Compliance Magazine, March 2024.
Share this story:
Bogdan Adamczyk headshot
Dr. Bogdan Adamczyk is professor and director of the EMC Center at Grand Valley State University (http://www.gvsu.edu/emccenter) where he performs EMC educational research and regularly teaches EM/EMC courses and EMC certificate courses for industry. He is an iNARTE-certified EMC Master Design Engineer. He is the author of two textbooks, “Foundations of Electromagnetic Compatibility with Practical Applications” (Wiley, 2017) and “Principles of Electromagnetic Compatibility: Laboratory Exercises and Lectures” (Wiley, 2024). He has been writing this column since January 2017. He can be reached at adamczyb@gvsu.edu.
Mathew Yerian-French headshot
Mathew Yerian-French is an electrical engineer specializing in EMC design and diagnostic testing. He received his B.S.E in Electrical Engineering from Grand Valley State University. He focuses on preventing EMC issues through design reviews and early EMC pre‑compliance testing and diagnostics. Mat participates in the industrial collaboration with GVSU at the EMC Center. He can be reached at mathew.french@e3compliance.com.