ith the continual decrease in power rail DC voltages and tolerances, oscilloscopes remain a key tool for development teams tasked with power integrity measurements. The continual trend to lower voltages and tolerances has driven the proliferation of power rail probe usage with oscilloscopes. The question of “should we purchase our first power rail probe” has changed to “what’s the best measurement technique”. Initial techniques have been refined as users and oscilloscope manufacturers collaborate and share insights and experiences.
A relatively unknown yet superior technique emerged from experts making power integrity measurements. This approach involving histograms and free-run trigger mode offers three key improvements compared to the traditional approach:
- By using a waveform histogram, users can visually and statistically compile power rail attributes;
- By using a single histogram measurement across all acquired waveforms instead of a measurement on each waveform, speed-of-test is accelerated, and with great accuracy; and
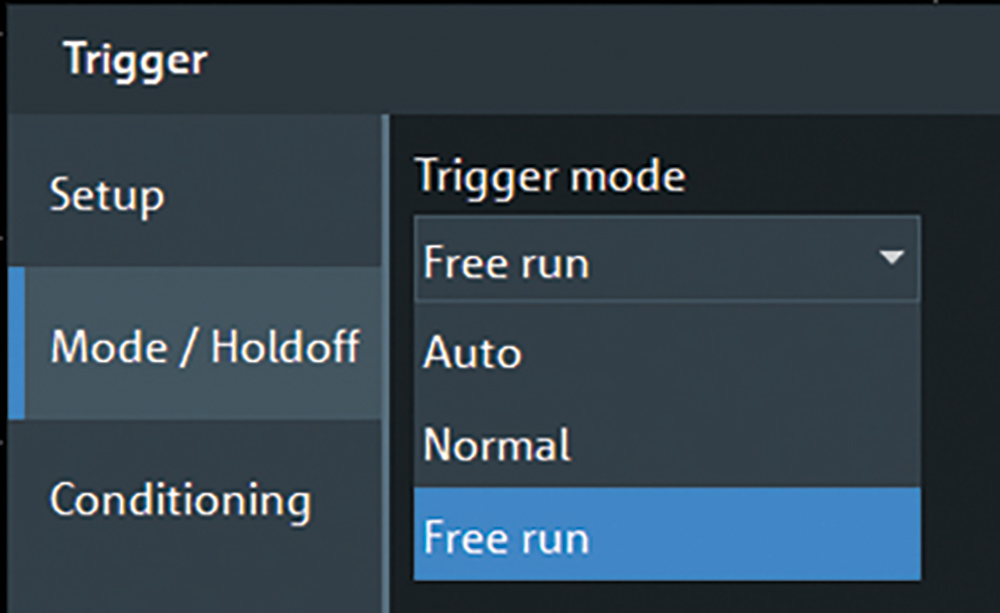
- By using free trigger mode, users get increased real‑time power rail coverage versus instrument dead‑time when the instrument is blind to power rail signal activity.
Oscilloscope users agree that a key issue with this traditional approach continues to be oscilloscope blind time. All oscilloscopes are subject to blind time between acquisitions. During this time, the oscilloscope is processing the last acquisition and cannot perform any new acquisitions until the previous one has been processed. While engineers are generally aware of this, many are not aware that the ratio between blind time and real-time signal acquisition can be extremely large. It is not uncommon to have 1000 times the amount of blind time compared to acquisition time.
Several attributes related to testing power rails lead to additional undesired blind time. Oscilloscope users never achieve the faster update rate needed for better testing and hence are only able to test snippets of time, while missing large amounts of rail signal activity between acquisitions.
Oscilloscope manufacturers communicate a waveform update rate (wfms/s) for specific oscilloscope families. This value describes the maximum speed at which the instrument can acquire and display signals. The fastest oscilloscopes in the world have a waveform update rate in excess of one million waveforms per second, while slower ones will have an update rate in the tens of waveforms per second. Waveform update rate describes a maximum value, but this value is not typical for power integrity measurements.
Maximum update rates occur at a specific time base setting, with the fastest sample rate, and without any measurements turned on. However, this is not descriptive of a power integrity test setup. At time bases of 1 uS/ and slower that are typically used for power rail measurements, blind time increases.
Testing power rails varies from other types of testing in that a trigger signal is not always readily available. Most oscilloscopes require a minimum voltage swing for detecting a trigger event. Power rails often do not have enough signal swing and hence users choose auto-trigger, which means if the oscilloscope does not find a suitable trigger it will table an acquisition after a predefined period of waiting, typically a few mS. This triggering issue also contributes to users missing significant time when the oscilloscope is not acquiring power rail activity. Alternatively, in normal mode when the oscilloscope is triggering on the signal, it still needs to re-arm the trigger after each acquisition, which in turn slows down the waveform update rate.
Lastly, turning on measurements on all oscilloscopes reduces the instrument’s acquisition rate. An oscilloscope that acquires 1 M waveforms per second without any measurements on might have a reduction to 350 acquisitions per second when measurements are turned on. An oscilloscope that normally acquires 50 waveforms per second might be slowed down to 5 acquisitions per second when a measurement is enabled. The need to process a measurement results in additional time during which the instrument is not actively acquiring power rail activity.
How much power rail activity do oscilloscopes miss? It is not uncommon for an oscilloscope with a fast update rate, a time base setting of 1 uS/div, and a single waveform measurement to have an update rate of 300 to 400 measurements per second. Is this fast? This update rate and time base combination means the oscilloscope is missing 99.6% of real-time power rail activity. Any anomalies that occur on the power rail during this blind time will not be recognized or measured by the oscilloscope. This processing speed tops other oscilloscopes where the update rate is just a few measurements per second, resulting in missing > 99% of power rail signal behavior.
Peak-to-peak voltage measurements are made on each individual waveform with results accumulated across multiple acquisitions. This provides a peak-to-peak range for each individual waveform, but it does not incorporate the largest maximum value versus the smallest minimum value that is acquired over successive acquisitions. What is needed is a peak-to-peak measurement that encompasses all acquisitions and updates as the oscilloscope acquires new power rail signal activity.
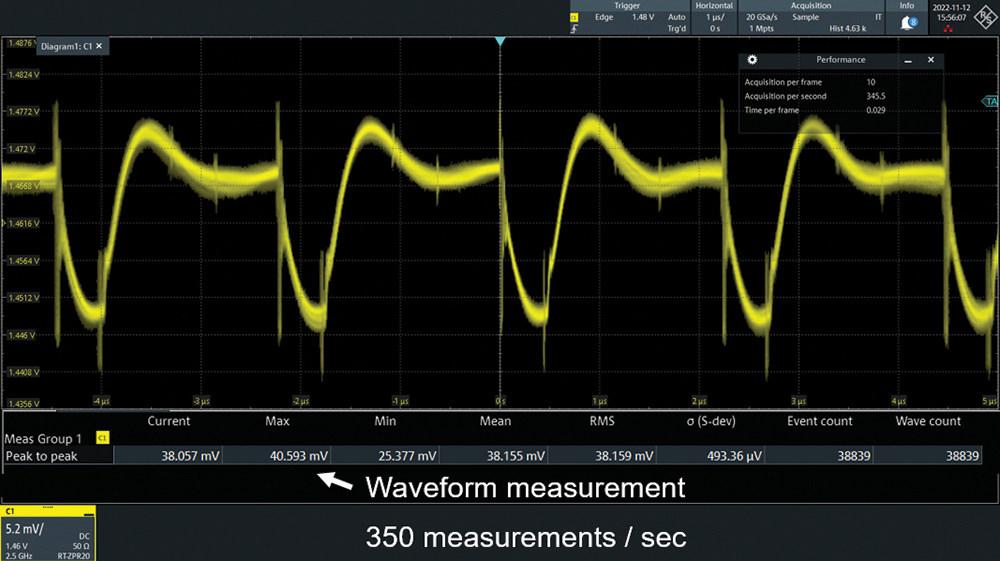
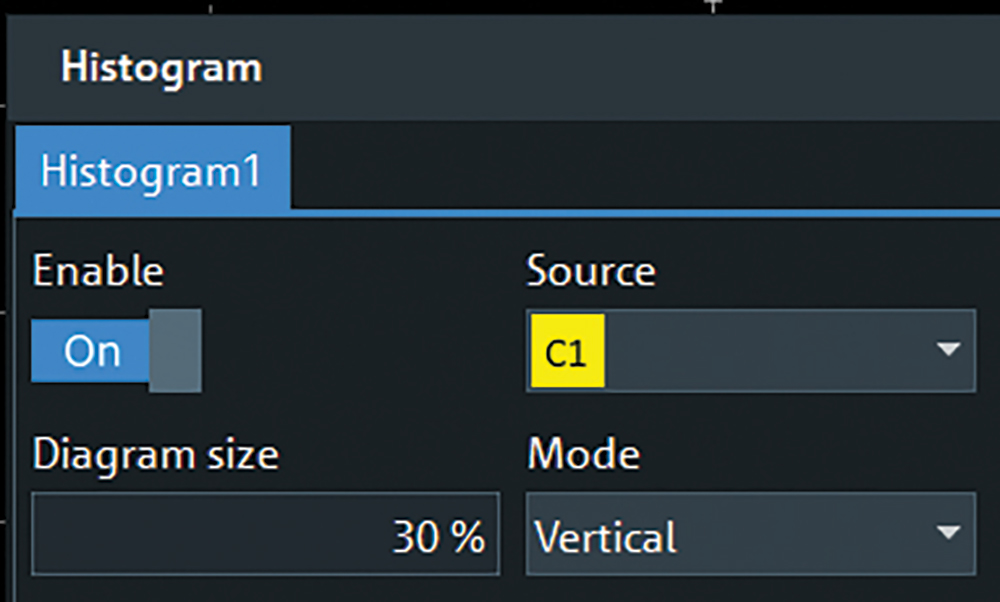
Figure 3 shows a waveform histogram of a power rail. From the histogram, the user can quickly determine how much of the time the signal under test spends on each level. The histogram incorporates information from all acquired samples in each acquisition and builds up with each successive acquisition.
Why use a waveform histogram? For voltage tolerance testing, the shape of the waveform is not important. What is important are the minimum and maximum values. Rather, ripple, noise, and disturbances present themselves as anomalies that exceed voltage tolerance levels. A histogram is a great visualization tool to see if tolerance levels have been violated.
For many oscilloscopes, waveform histogram processing is done in hardware, and the oscilloscope experiences little to no drop in the maximum waveform update rate. With waveform histograms, such instruments can measure 20 times more acquisitions per second versus using a Vpp measurement on each acquisition. Such oscilloscopes capture as much as 20 times more real-time signal activity on the rail.
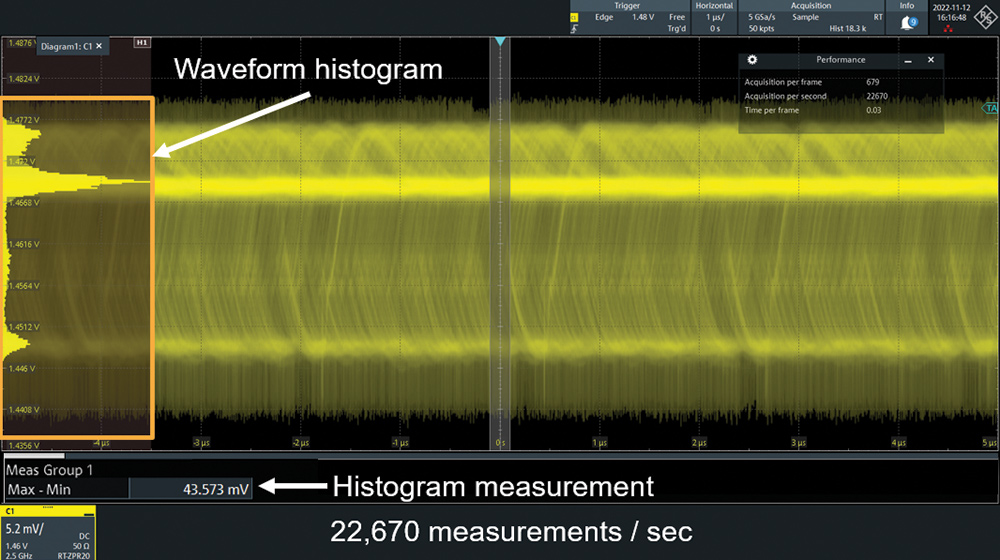
In addition to the speed increase, the peak-to-peak measurement on the histogram is made across all acquired data. It constitutes the true max peak-to-peak voltage from the highest value versus the smallest value. This provides the correct overall peak-to-peak value overall acquired data, versus the less accurate traditional approach that measures just the worst-case single acquisition that may not include the highest maximum voltage and the lowest minimum voltage of all acquisitions.
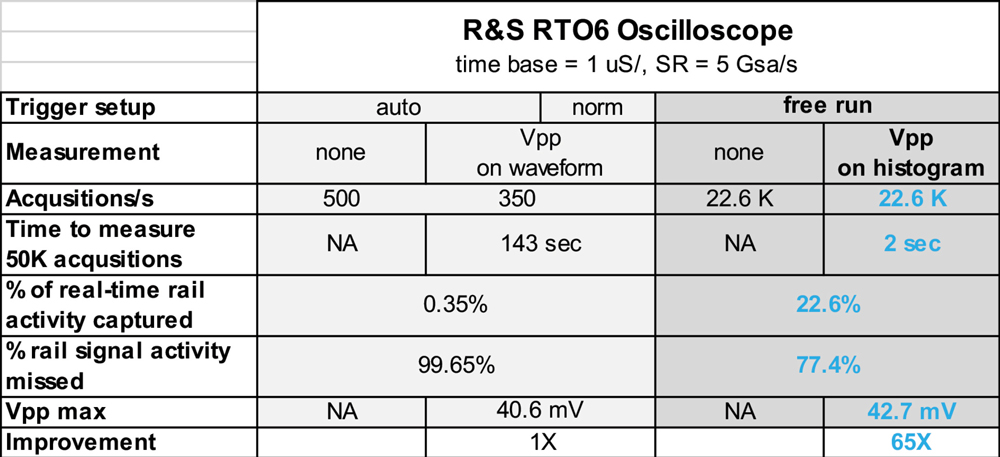
Like many approaches, combining multiple techniques yields significant advantages. For power rail testing with oscilloscopes, using waveform histograms, plus measurement on histograms, plus free run trigger mode enables users to capture and analyze a significantly higher percentage of rail activity than the traditional method of making peak-to-peak voltage measurements on individual waveforms with the oscilloscope’s trigger set to auto or normal mode.