

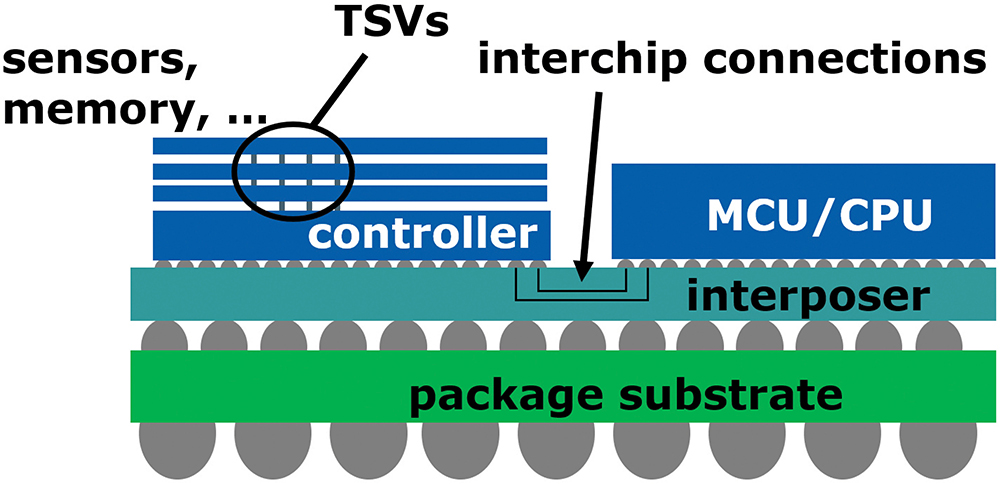
n the semiconductor industry, there is currently a growing trend towards Multi-Chip Modules (MCM) and Systems in a Package (SiP). These MCMs and SiPs consist of multiple dies/chiplets, sensors, and often delicate optoelectronic components that have minimal protection against Electrostatic Discharge (ESD). Figure 1 presents a schematic representation of such a MCM, including the internal pins, through silicon vias (TSV) and interposers, that do not have any connection to the outer world once assembled.
However, there is a lack of available data that correlates the measured voltage in a production machine with the discharge currents that may occur during the production process, such as the pick and place process. This limitation prevents the evaluation of the robustness of a bare die solely based on the determination of the failure current. Publication [10] presents a method on how to correlate the discharge current with the pre-charge voltage based on the package parameters. However, the actual currents occurring during the assembly process, for instance inside a pick and place machine, are currently unknown. This paper proposes a method of how to close this gap by directly measuring the occurring discharge current during the pick and place process. These data provide valuable information about the maximum currents which have to be taken into account during the development stage of the ESD protection.
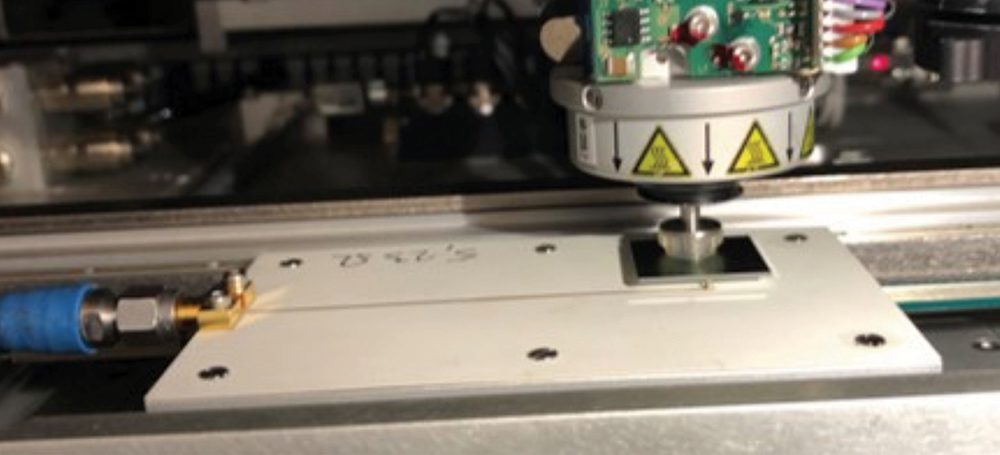
Section II shows first measurements with a multi‑purpose current monitor designed for detecting secondary discharge during system level ESD testing [11]. Section III follows with the design of a dedicated Discharge Current Sensor (DCS), which can be placed directly into an assembly machine. This DCS is further used in Section IV for the evaluation of discharge currents in a laboratory environment and in a production machine (Sub-sections A and B).
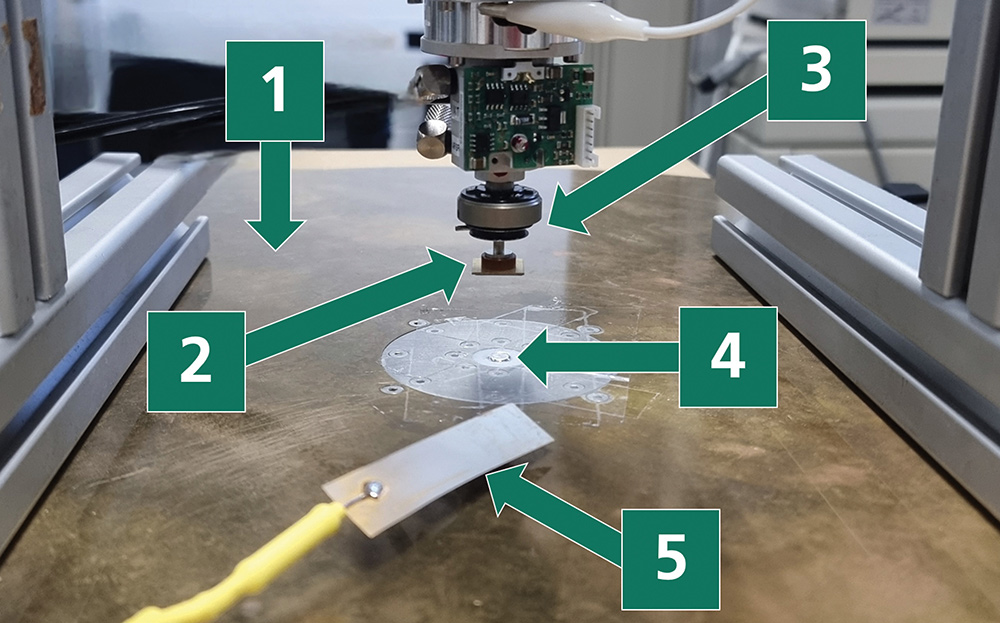
To obtain the correct discharge current, it is of importance to charge the DUT at the same Z-height as the discharge occurs, as the capacitance changes with the distance from the ground plane. Therefore, the following test sequence is applied: 1) the DUT is elevated and the current monitor covered with a thin ceramic plate, 2) the charging probe is placed on the ceramic plate and the DUT is lowered in the touchdown position contacting the charging probe (=charging of the DUT), 3) the DUT is elevated again and the ceramic plate is removed, 4) the DUT is lowered in the touchdown position and discharges into the current monitor.
For the first preliminary measurements with the available current sensor used in [11], six positive and negative pre-charge voltage points are chosen to see the tendencies for the discharge currents. The lowest pre-charge voltage starts at 50 V and goes up to 300 V in 50 V steps. Figure 3 shows the absolute peak currents for the given pre-charge voltages. The peak current increases with the pre-charge voltage. However, due to the occurring air discharge, there is a strong variation of the peak current. Moreover, the surface of the current sensor’s electrode is fairly large compared to the size of the DUT, which makes the contact face undefined. This may further increase the variation of the peak currents and emphasize the need for a specialized current sensor.
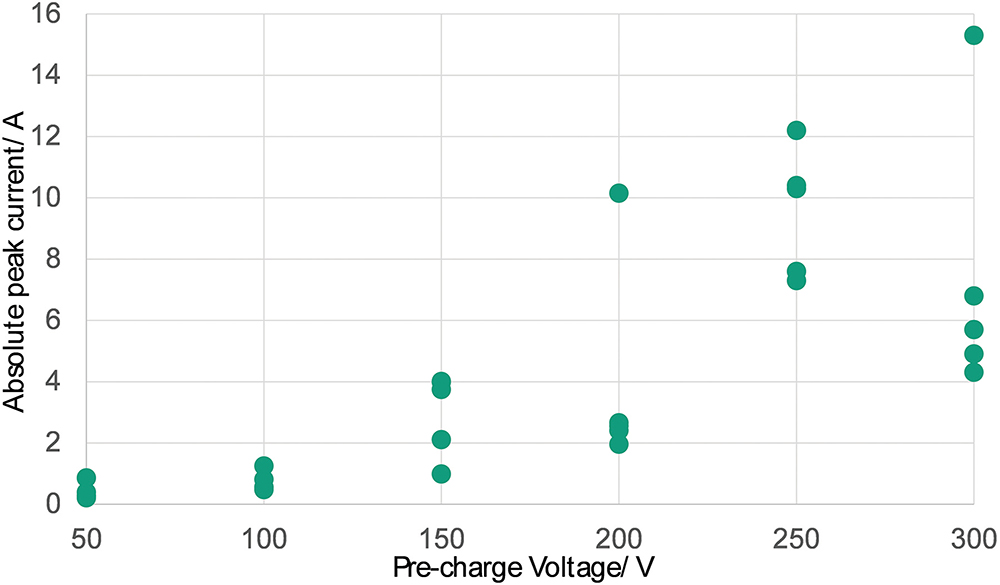
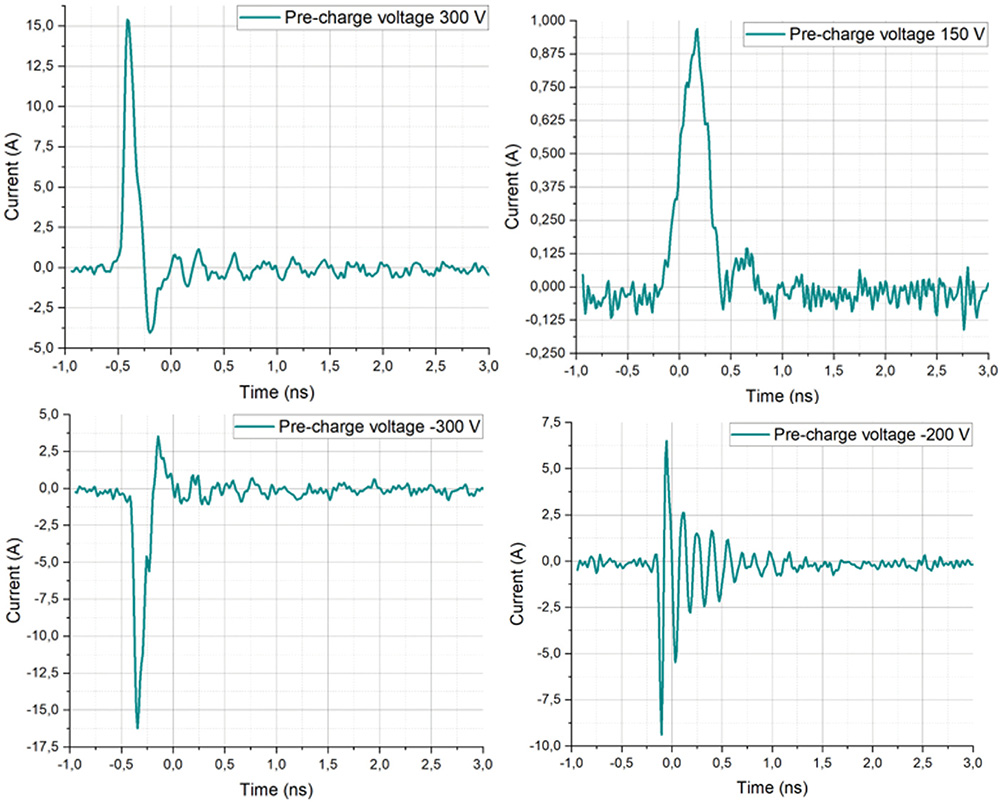
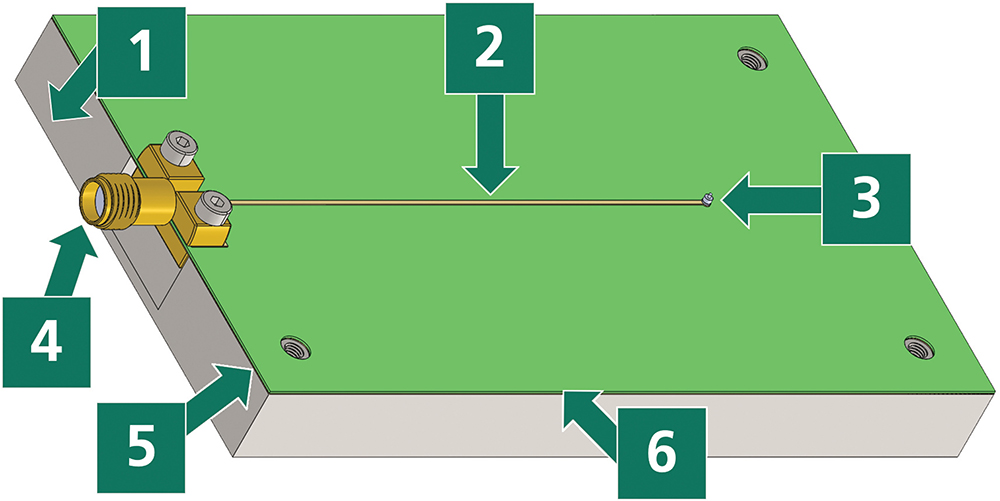
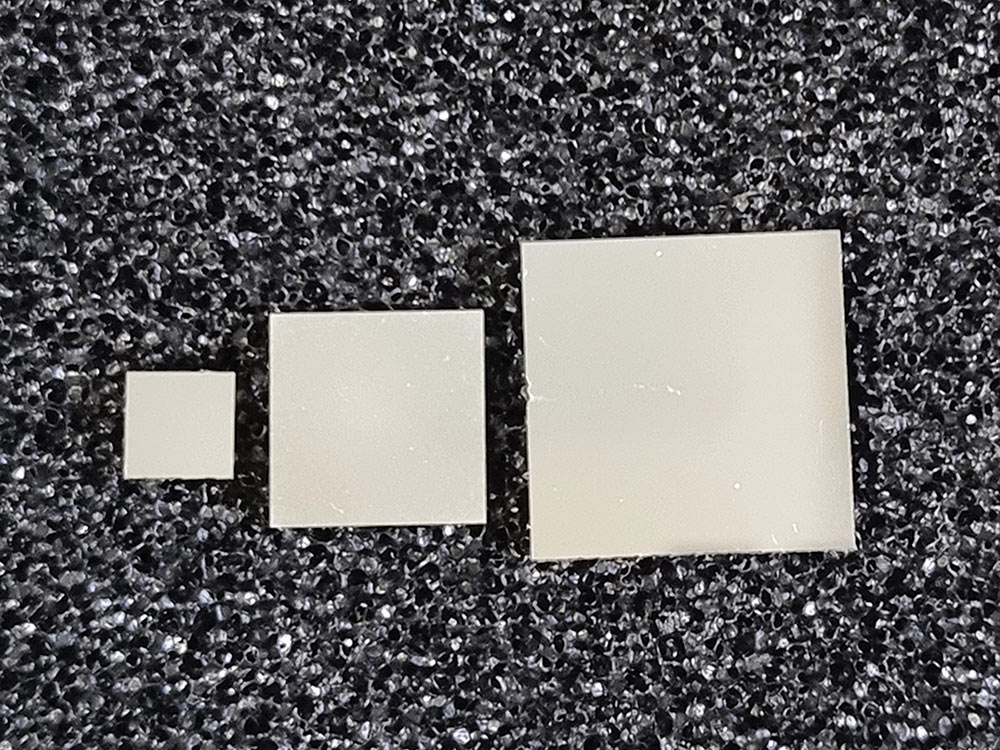
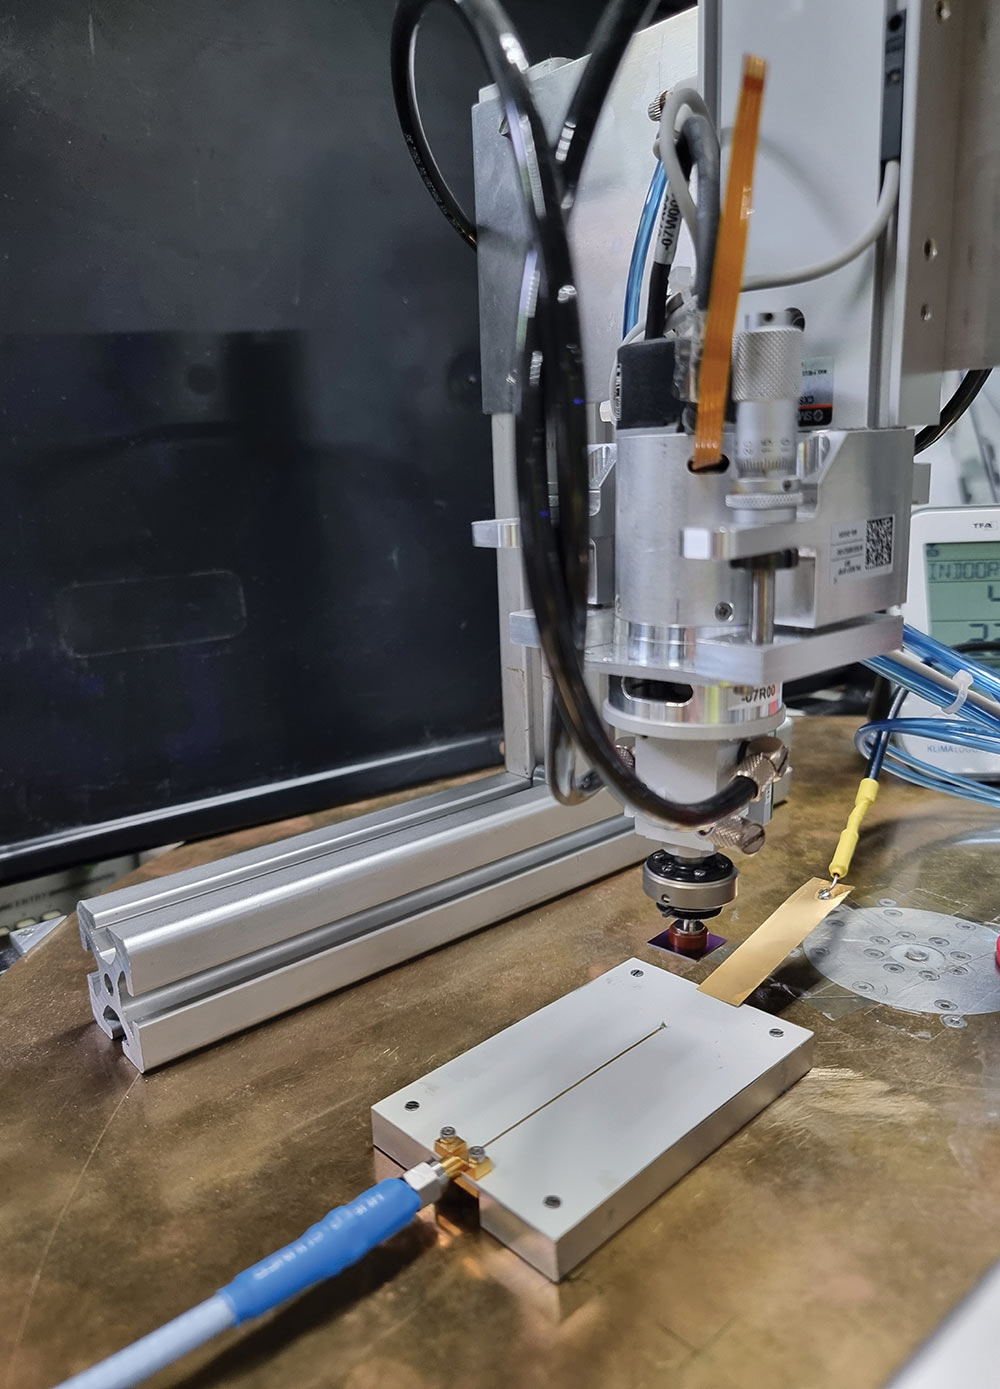
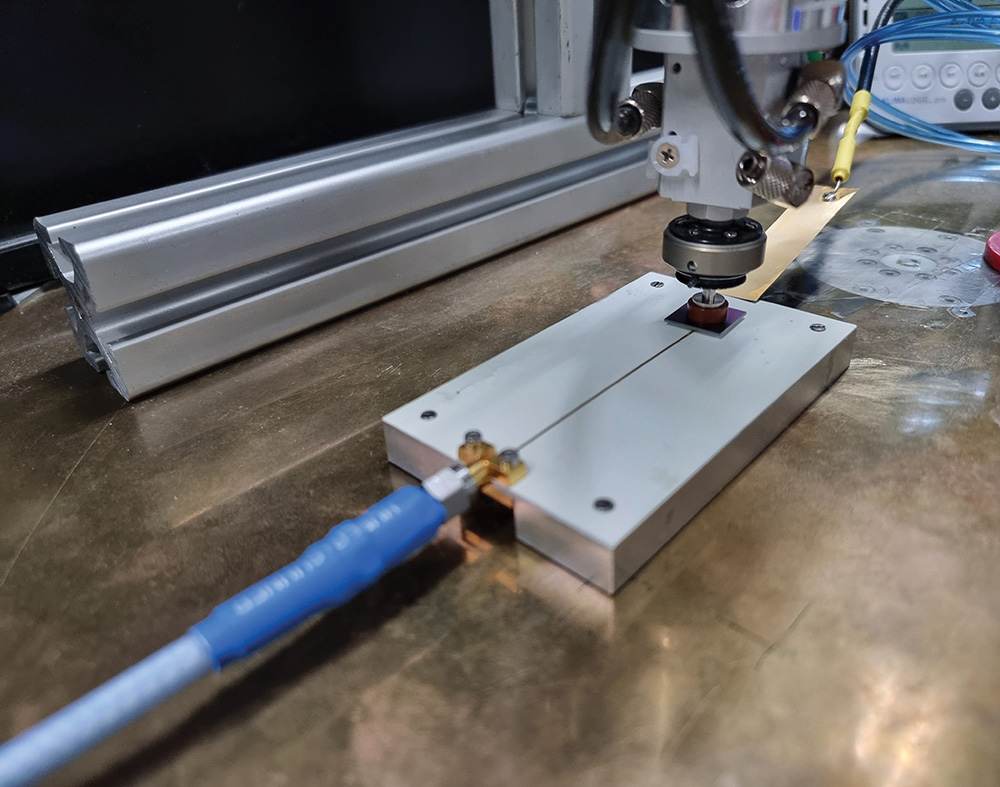
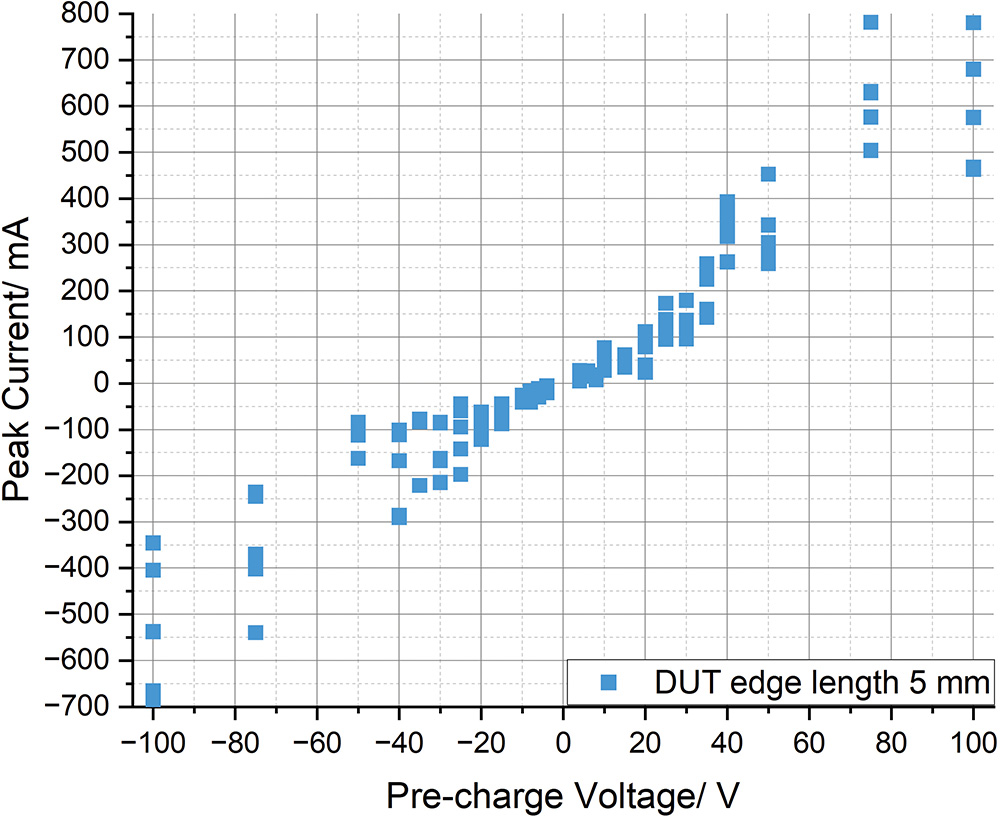
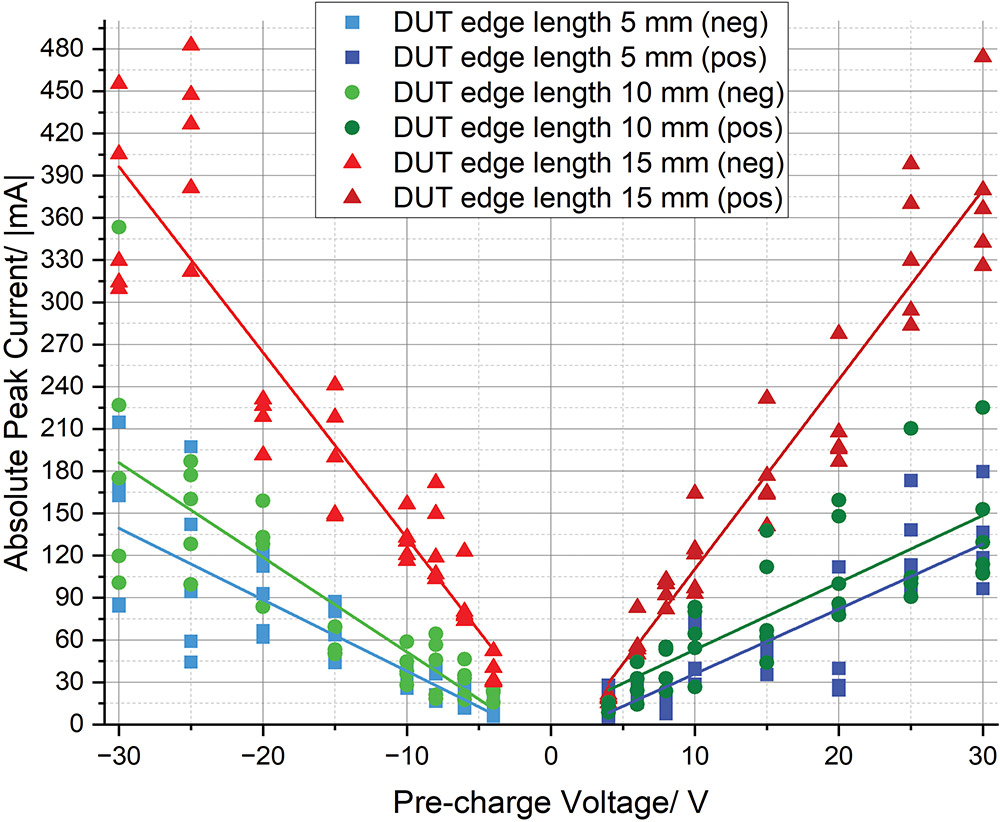
Figure 9 depicts the peak values of the discharge current for the smallest DUT with an edge length of 5 mm. 5 peak current values are listed for each of the 26 voltage levels.
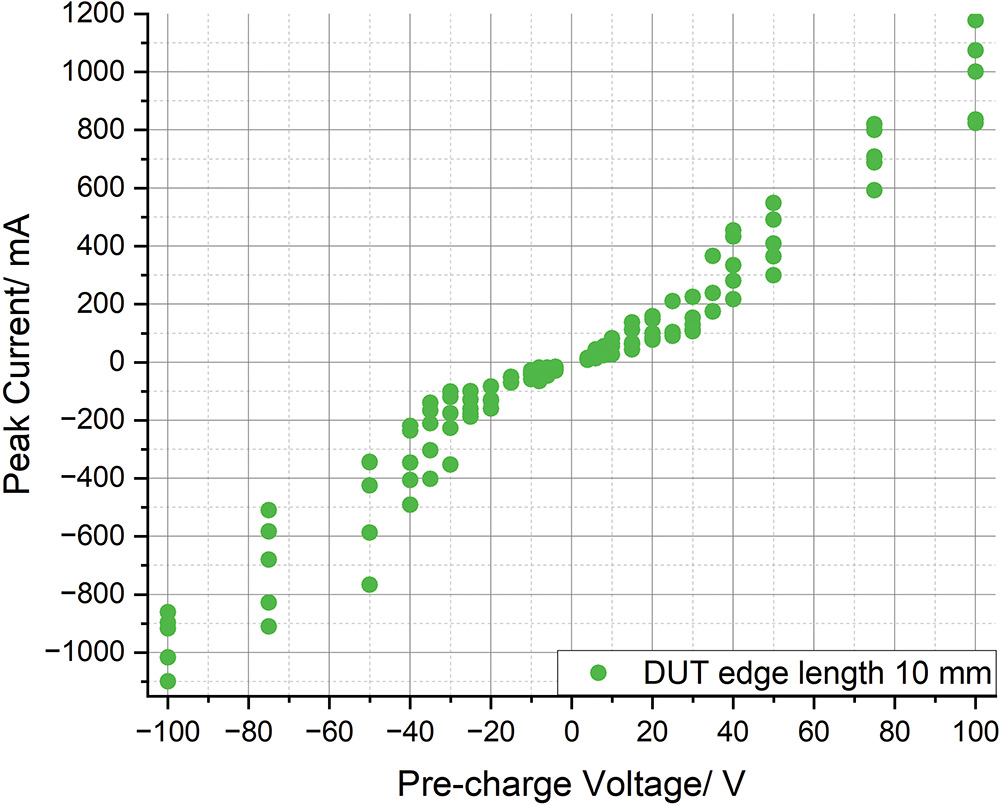
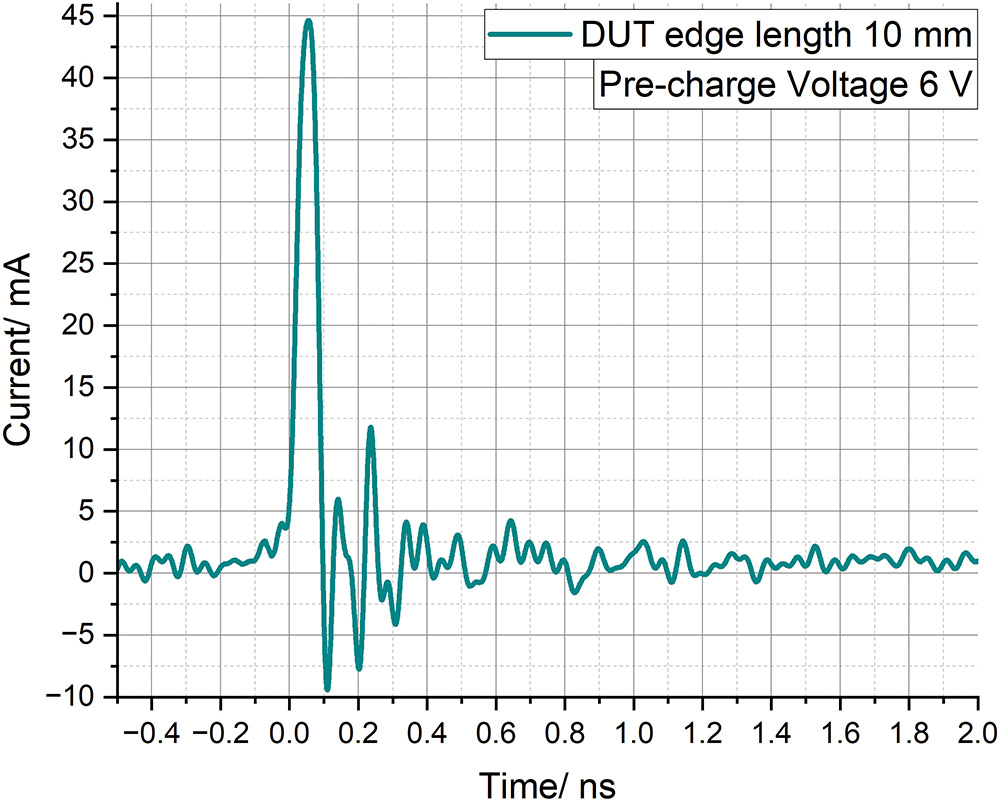
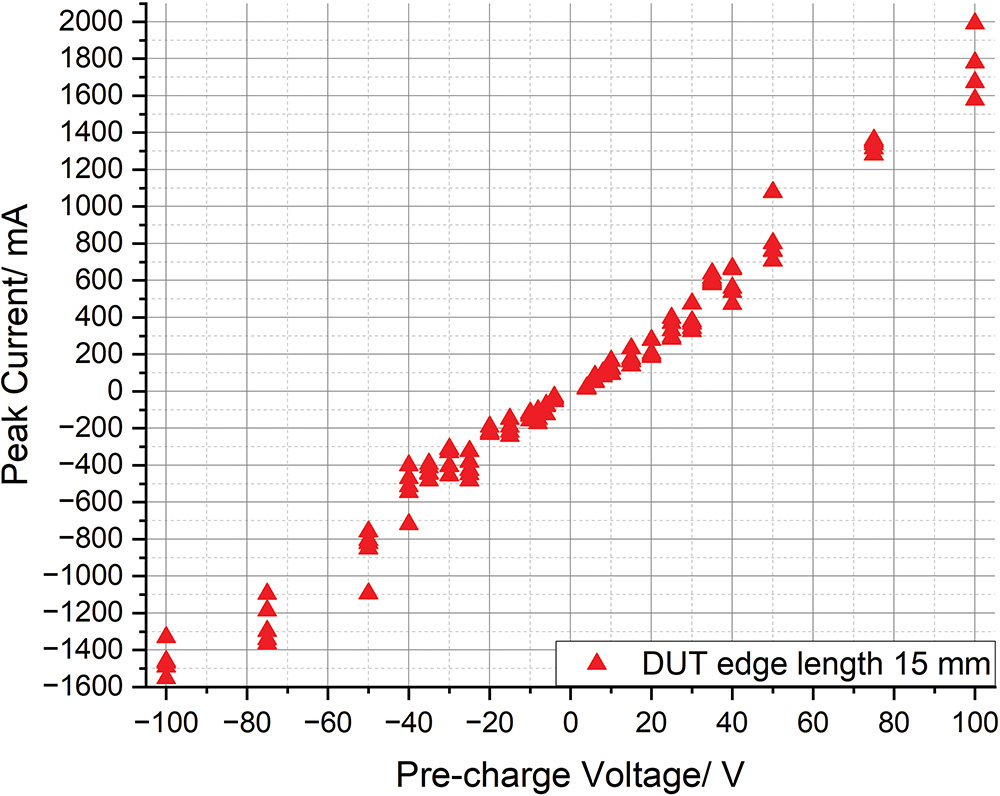
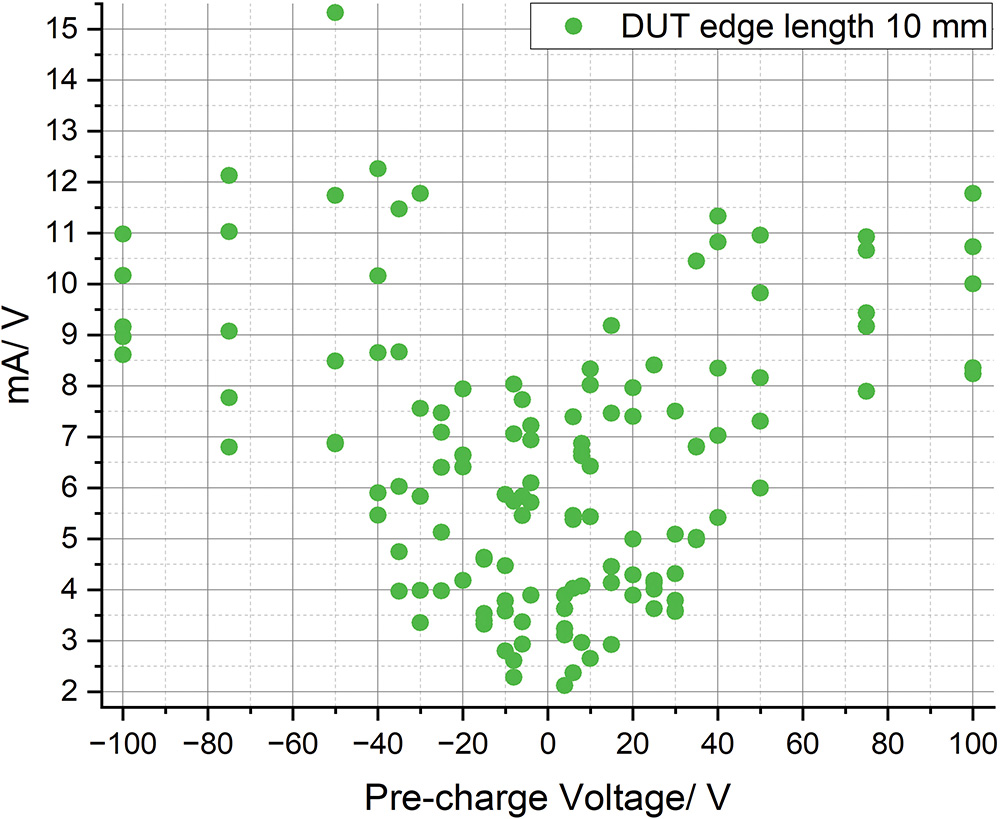
The data in Figure 13 show higher current values per Volt for pre-charge voltages higher than 30 V. The mean value in this region is in the range of 10 mA/ V. For pre-charge voltages below 30 V, the mean value is in the range of 5 mA/ V. This supports the hypothesis of different discharge mechanisms for the different pre‑charge voltage regions.
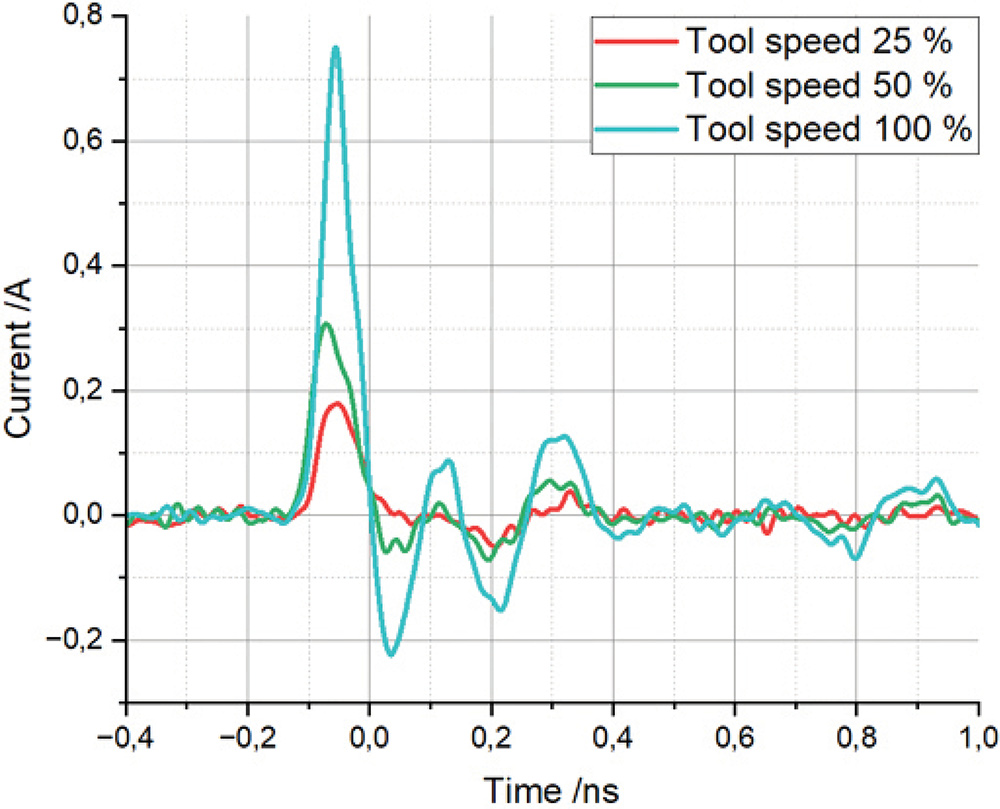
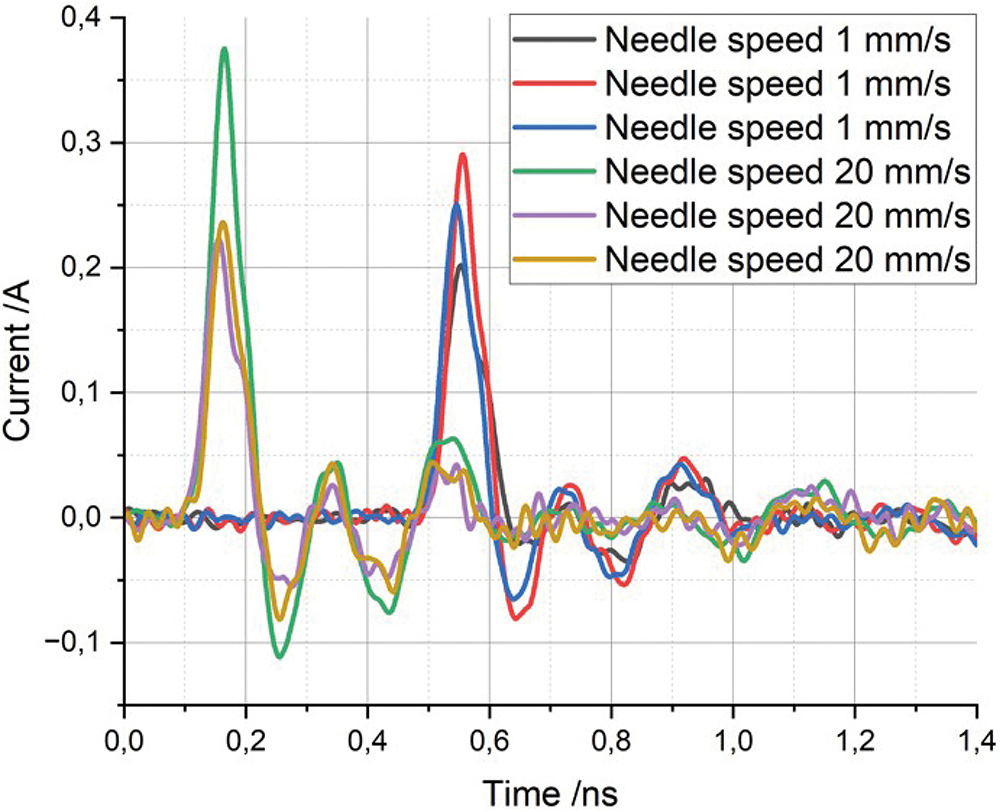
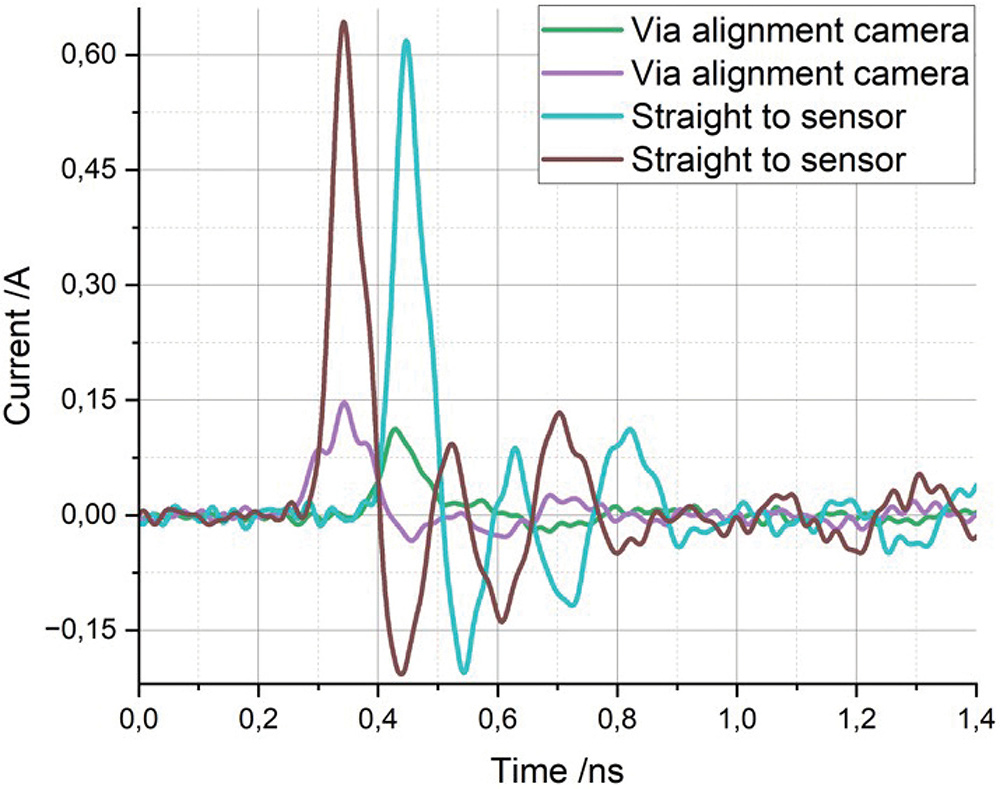
As an outlook, more statistical data should be collected. For this purpose, an automated measurement setup is required. A re-designed Discharge Current Sensor, which will speed up the measurements, is already in the development stage.
This project was partially funded by the Silicon Valley Community Foundation.
- ESDA/JEDEC Joint Standard ANSI/ESDA/JEDEC JS-002-2022 Charged Device Model (CDM) – Device Level.
- ANSI/ESD SP5.3.4-2022 ESD Association Standard Practice for Electrostatic Discharge Sensitivity Testing – Capacitively Coupled – Transmission Line Pulsing as an Alternative CDM Characterization Method.
- H. Wolf, H. Gieser, W. Stadler, W. Wilkening, “Capacitively Coupled Transmission Line Pulsing CC-TLP – A Traceable and Reproducible Stress Method in the CDM-Domain,” Journal of Microelectronics Reliability, Elsevier, volume 45, no. 2, 2005, pp. 279-285.
- H. Wolf, H. Gieser, K. Bock, A. Jahanzeb, C. Duvvury, and Y.-Y. Lin, “Capacitive coupled TLP (CC-TLP) and the correlation with the CDM,” 2009 31st Electrical Overstress/Electrostatic Discharge Symposium (EOS/ESD), Anaheim, CA, USA, 2009.
- K. Esmark, R. Gärtner, S. Seidl, F. zur Nieden, H. Wolf, H. Gieser, “Using CC-TLP to get a CDM Robustness Value,” 2015 37th Annual EOS/ESD Symposium (EOS/ESD), Reno, NV, USA, 2015.
- J. Weber, K. T. Kaschani, H. A. Gieser, H. Wolf, L. Maurer, N. Famulok, R. Moser, K. Rajagopal, M. Sellmayer, A. Sharma, and H. Tamm, “Correlation study of different CDM testers and CC-TLP,” EOS/ESD Symposium Proc. 2017, Tucson, AZ, USA.
- J. Weber, R. Fung, R. Wong, H. Wolf, H. A. Gieser, L. Maurer, “Stress current slew rate sensitivity of an ultra-highspeed interface IC,” IEEE Transactions on Device and Materials Reliability, vol. 19, issue 4, November 2019.
- N. Jack, B. Carn, and J. Morris, “Toward Standardization of Low Impedance Contact CDM,” 2019 41st Annual EOS/ESD Symposium (EOS/ESD), Riverside, CA, USA, 2019.
- M. Simicic, W.-M. Wu, N. Jack, S. Tamura, Y. Shimada, M. Sawada, S.-H. Chen, “Optimization of Wafer-Level Low-Impedance Contact CDM Testers,” in 2020 42nd Electrical Overstress/Electrostatic Discharge Symposium (EOS/ESD), Reno, NV, USA, 2020.
- L. Zeitlhoefler, T. Lutz, F. Zur Nieden, K. Esmark and R. Gaertner, “Voltage to Current Correlation for CDM Testing,” 2023 45th Annual EOS/ESD Symposium (EOS/ESD), Riverside, CA, USA, 2023.
- H. Wolf, H. Gieser, “Secondary discharge – A potential risk during system level ESD testing,” 2015 37th Electrical Overstress/Electrostatic Discharge Symposium
(EOS/ESD), Reno, NV, USA, 2015.