ython has become a widely used programming language in the area of electronic test automation, especially when used with the PyVISA library. While the fundamental principles of lab automation have been around for a long time (i.e., the SCPI protocol), Python and PyVISA have made it easy to get started quickly with test automation. Once data has been collected, Python also has a plethora of data analysis tools (pandas, scipy, scikit, etc.) that are useful in analyzing data.
In this article, I will introduce how to interface with instruments using Python/PyVISA and give a practical example of measuring power supply efficiency. Finally, I will introduce how to plot gathered efficiency data directly in Python.
PyVISA works as a front end to the VISA library and simplifies the process of communicating with instruments. PyVISA is officially tested against National Instruments’ VISA and Keysight IO Library Suite and can be used with hardware adapters from National Instruments, Keysight, and many others.
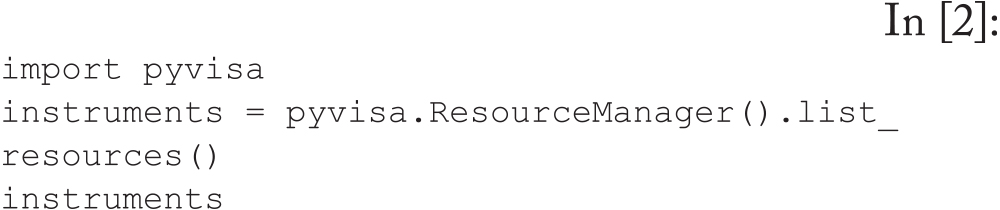
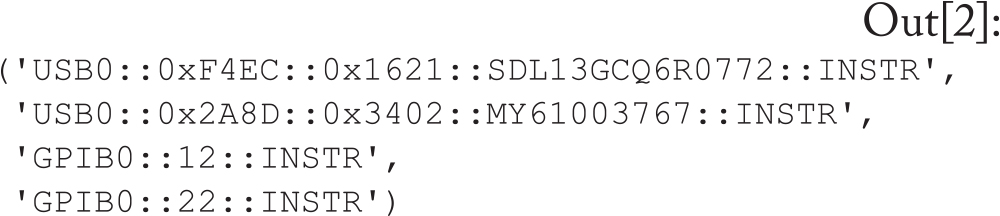
To get started, here is a simple program that queries what instruments are visible to PyVISA on my computer. In the below code snippet, I am using National Instruments VISA on a 64-bit Windows computer running Python 3.11.5 and PyVISA 1.13.0


Since each measurement requires four values (input voltage, input current, output voltage, and output current), we need sufficient equipment to read all these parameters. In practice, it is beneficial to measure the input and output voltage on separate meters as close to the DUT as possible.

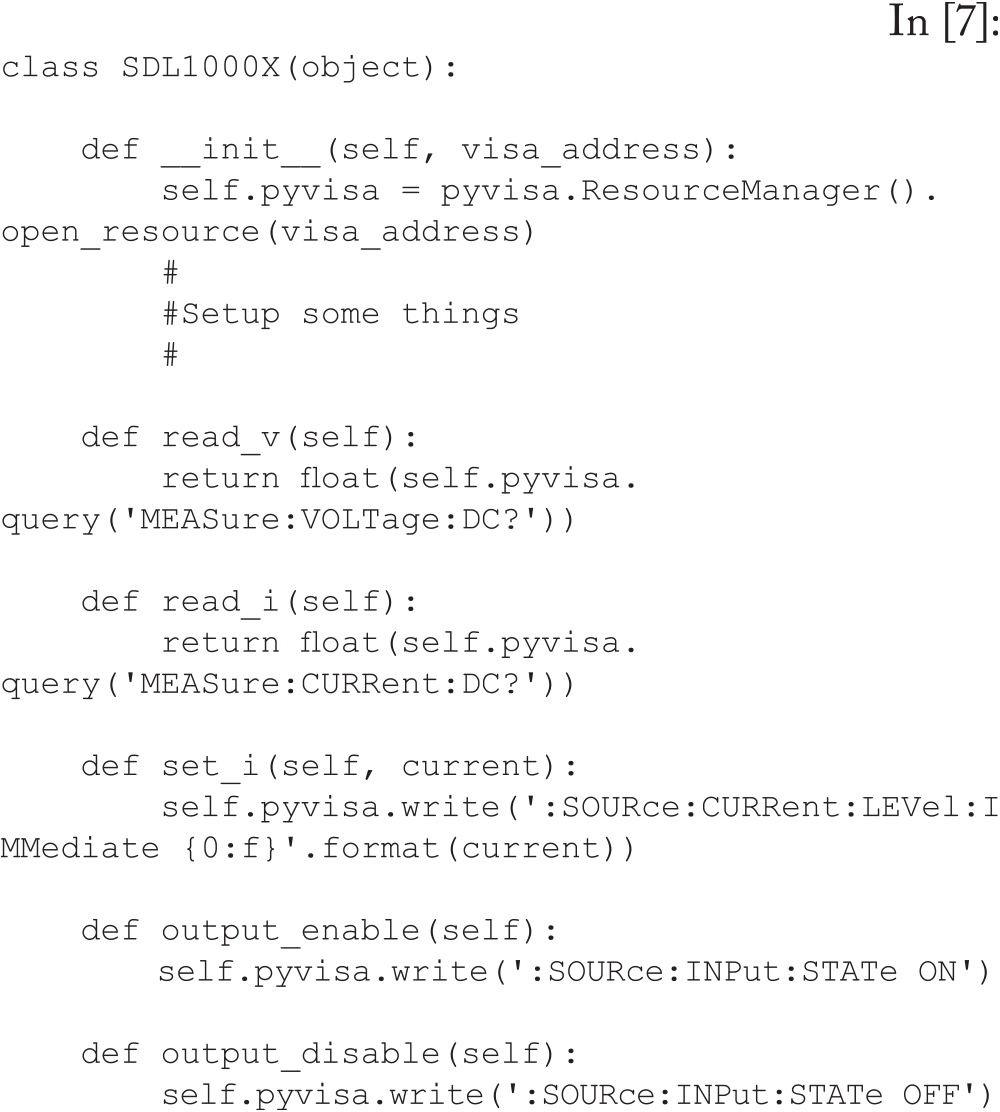
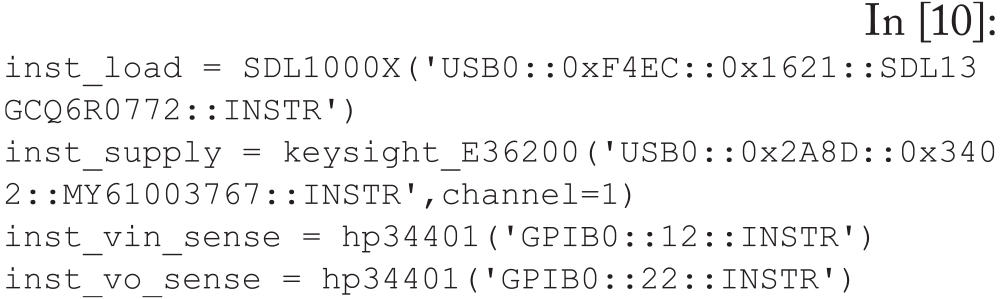
For this test, we will need four instrument objects, though the voltage measurements will be instances of the same object with different addresses (same meter, different GPIB address).


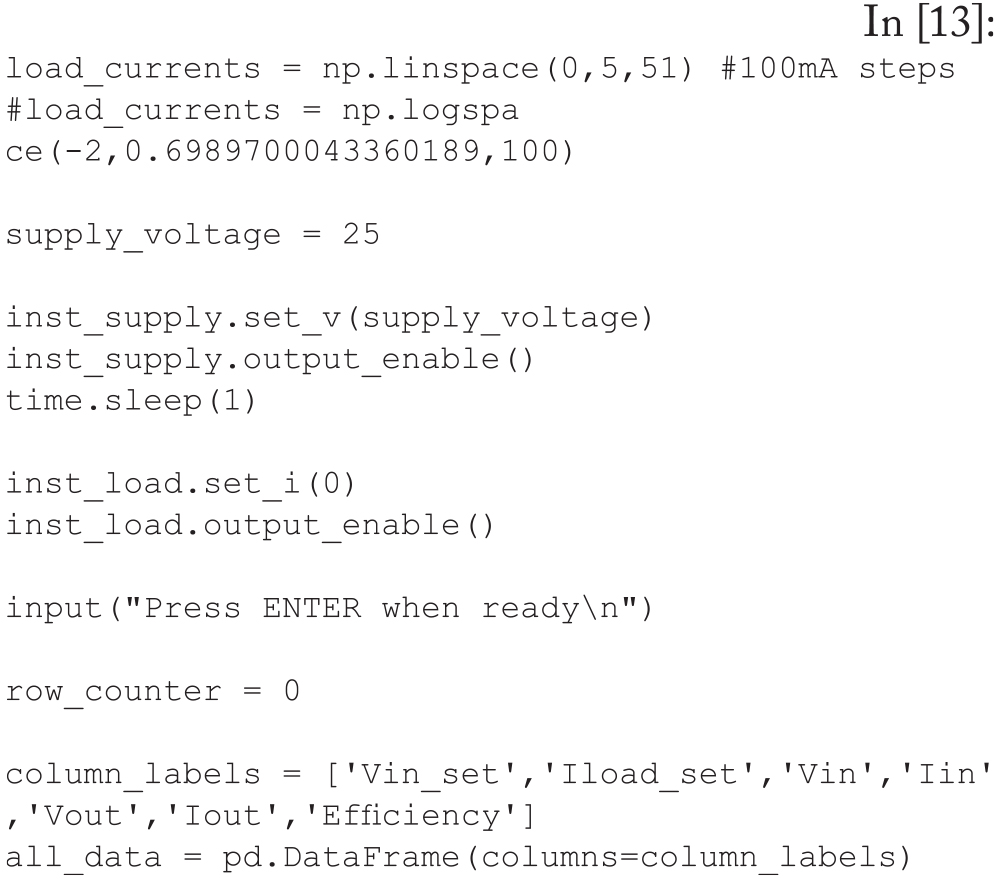
- Set the next load current value on the electronic load;
- Wait for the current to stabilize;
- Calibrate the input voltage (right at the DUT) to keep this close to the supply voltage value;
- Read all meters and calculate efficiency;
- Store all read data as a new row in the all_ data DataFrame; and
- Increment the row counter and continue to the next load value.


With the basic program in place, it is possible to modify this program to add features, including:
- Loop through different input voltages;
- Change the tested currents;
- Save plot data as image or pdf files; and
- Save data as a Word document or PowerPoint slides.