The question has been asked for many years: which parameter does the human body respond to: peak or RMS? More experimental research needs to be done to study the comparative effect of peak and RMS values on the human body. In the 1940s, Charles Dalziel conducted human body experiments to study the physiological effects of “the inability to let-go” [1] (or “let-go”) and “perception” [5], and he concluded that the electrical shock physiological effects are controlled by the peak value, not the RMS for 60 Hz sinusoidal waveforms. Dalziel conducted extensive experimental research on the effects of current on the human body and is still cited as an authoritative source for electric shock data; that said, his research has some limitations in scope. For example, most of his experiments were conducted using single-frequency sinusoidal signals when determining the “let-go” current limit for human volunteers [1]. Dalziel did study the effects of other types of waveforms, but these were limited to triangle, square, half-rectified and full-rectified waveforms with a fundamental frequency of 60 Hz. Dalziel also conducted experiments combining a 60 Hz sinusoidal waveform with its third harmonic (180 Hz) set equal to 37.5% of the fundamental when he found peak current as the critical factor in stimulating the human body [6]. In the discussion section of Dalziel’s paper [6], J.A. Dickinson and F.B. Silsbee from the National Bureau of Standards (now the National Institute of Standards and Technology, NIST) questioned the validity of concluding that human body stimulation was controlled by peak current based on a single frequency or combined signals with third harmonics only. Therefore, these foundational tests by Dalziel are not easily relatable to waveforms commonly encountered today and still leave an open question on whether peak or RMS is the more appropriate parameter to assess shock hazards for non-sinusoidal waveforms.
In 1985 Hart reported experimental results comparing the electrical shock sensation of the peak and RMS for mixed- frequency signals [7]. The mixed signals explored by Hart were composed of a 60 Hz fundamental and secondary signal with frequencies between 30 to 100 kHz. Hart conducted testing on “several” people and six different secondary frequency signals and came to a similar conclusion as Dalziel that the peak is the determining factor for physiological effects rather than RMS.
Based on Dalziel and Hart’s experimental results, Perkins demonstrated the complicated leakage/touch current waveforms for various products, including switch mode power supplies, variable speed drives (VSDs), network servers, etc.[8] In his paper, Perkins also demonstrated a method of measuring the peak leakage/touch current value using an oscilloscope and the traditional leakage current measurement network provided in both UL 101 and IEC 60990. In 1997, subsequent work led by Hart and Perkins reported experimental results with human volunteers comparing average, peak, and RMS values of various waveforms with an equivalent 60 Hz sinusoidal (equivalent with respect to perception). The result of this work was included within the American National Standards Institute (ANSI) Standard C101 (now UL 101). In that study, different types of waveforms were considered but only for a single frequency of 60 Hz, which is not a true representation of the practical waveform exhibited by the products nowadays.
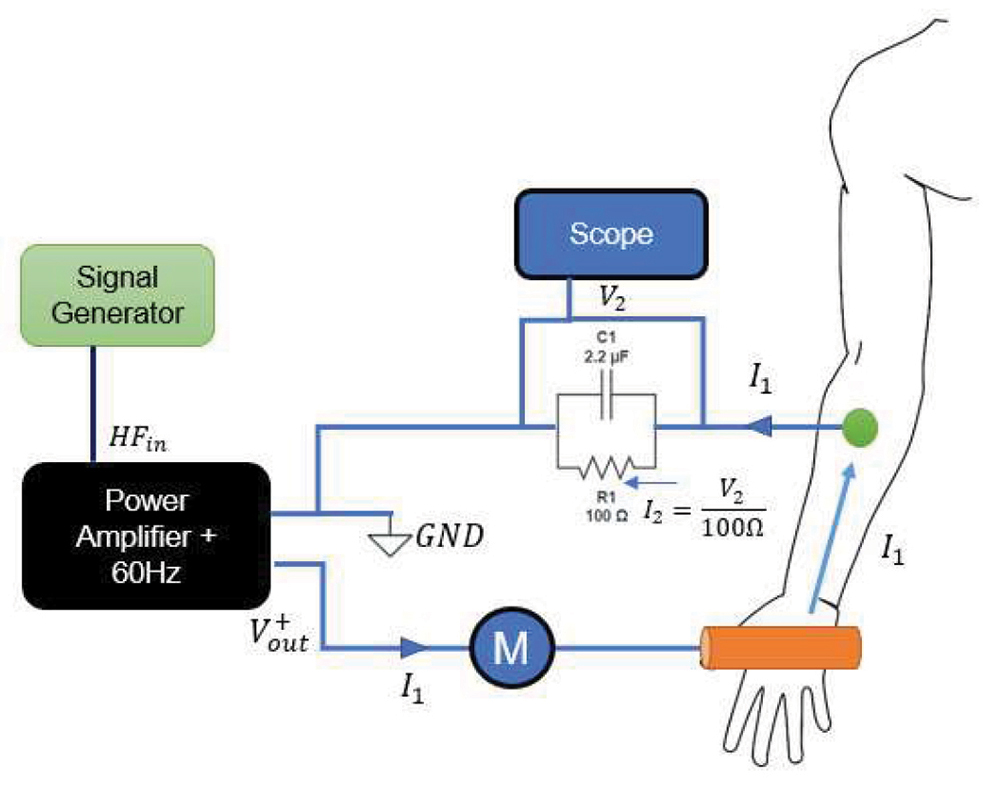
Figure 1 shows the experimental setup for the complex waveform study. The power amplifier can mix three individual frequency signals plus a 60 Hz sinusoidal (integrated within the amplifier). The power amplifier has a bandwidth of 100 kHz (−3 dB @ 100 kHz), and the output current is hardware limited to 35 mA for all frequencies for safety considerations. The maximum output voltage was also limited to 120 Vrms for safety. The current pathway was set from the lower arm to the hand (as shown) to mitigate the potential of current passing through the heart. The electrode on the arm consisted of an electronic pad manufactured by TENS for electrotherapy, as shown in Figure 1. The other electrode consisted of a copper cylinder, similar to that used by Dalziel [1] and for work previously published by the authors [9].
The leakage current measurement circuit in both UL 101 [2] and IEC 60990 requires the reaction threshold network. It is noted that reaction is a different physiological effect than perception. Perception is an initial sensation of starting to feel the flow of electricity through the body. Reaction is what occurs when the electrical current is high enough for a person to “react” from the energized source. Perception will not likely lead to harmful injury, but reaction can lead to a secondary injury, e.g., falling from a ladder. Like perception, the reaction network is a low-pass filter compensating for the decrease of shock sensation for a given current magnitude as the frequency increases and is based on experimental measurements of perception/reaction as a function of frequency (for example, from Dalziel’s work). It is noted that Dalziel measured the perception threshold, which is a less intense physiological effect than the reaction; therefore, the absolute body current of Dalziel’s results is expected to be lower than the reaction current. This study focused on the reaction effects instead of perception because the reaction current can lead to harmful injuries and the reaction limit is the requirement of both the UL 101 and IEC 60990 standards.
Reaction is here defined as an uncomfortable sensation during which the volunteer reacts to the test current while holding the energized electrode. Several preliminary tests were conducted to familiarize the two test subjects with the sensation of the current at different frequencies. The experiment started with 60 Hz at 1 mA, which is above the perception threshold but lower than the reaction limit which is up to 2 mA. For the first few seconds, the touch current continued to increase due to transient/reactive effects at and near the skin interface. Once the current stabilized at 1 mA, the current was then increased to the reaction sensation of the subject. The subject was asked to memorize this sensation and attempts were made to adjust the current levels throughout this study to recreate the same sensation for all further experiments.
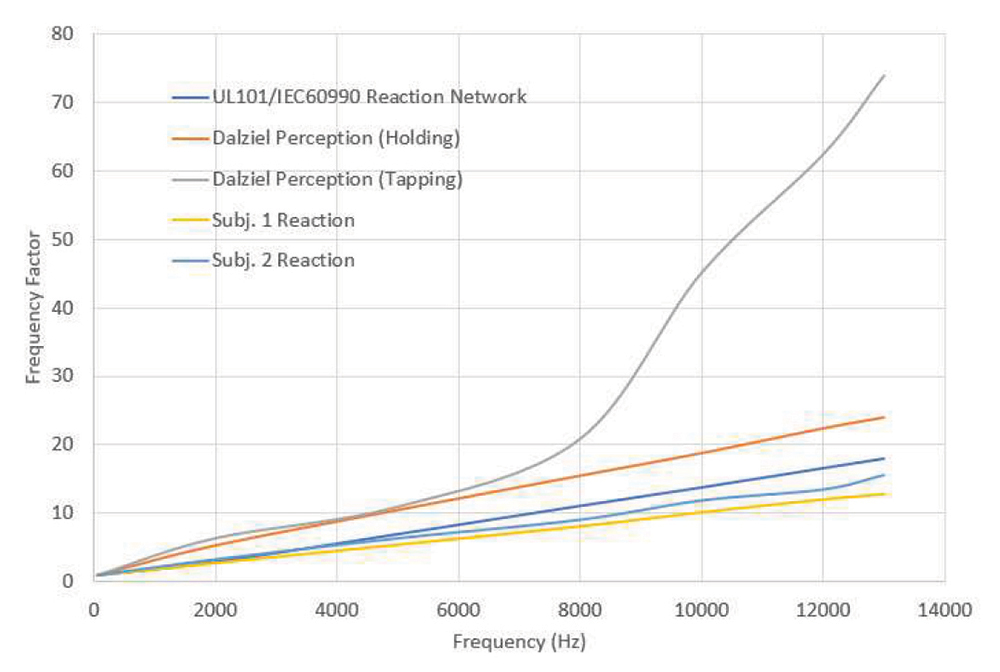
Reaction thresholds were measured for two volunteers in the range of frequencies from 60 Hz to 15 kHz. Current thresholds at higher frequencies were not measured due to the maximum output current limitation of the power amplifier and its safety limits. Similar trends were expected based on Dalziel’s results, though measurement of a “personal” reaction curve for each test subject was expected to improve accuracy since results depend on each individual’s perceived sensation while the Dalziel curve is based on a statistical average from a larger population of test subjects.
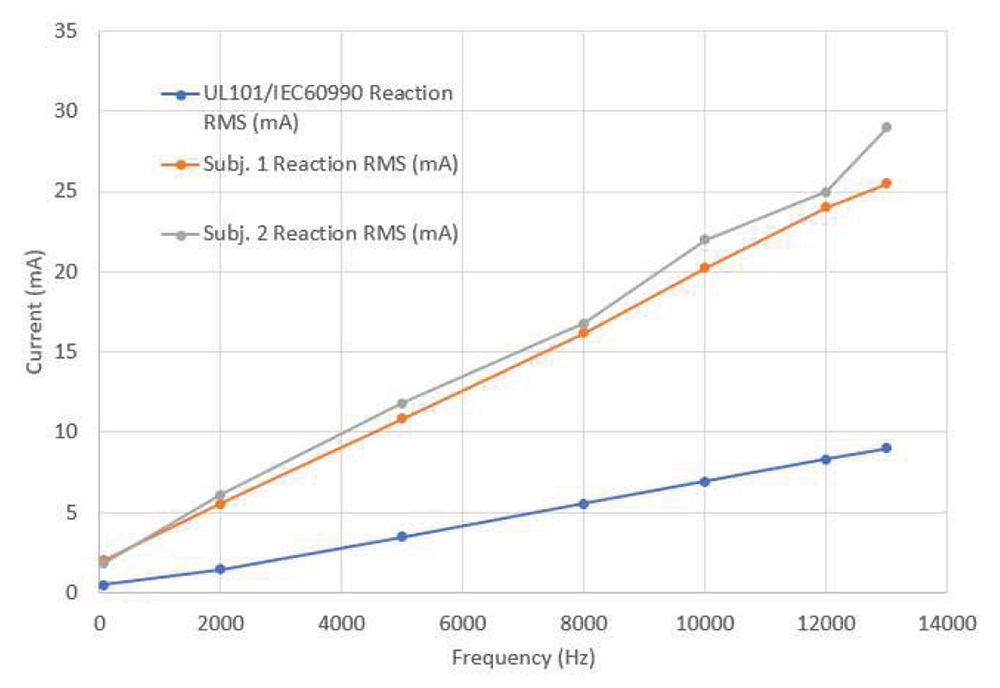
As shown in Figure 3, the personal reaction currents were quite close for the two test subjects but higher than the UL 101 threshold limits. This can be understandable since the standard limit is intended to protect 95% of the population from reaction and therefore would typically be more conservative than curves from individuals. The two subjects are both male, between 40 to 50 years old.
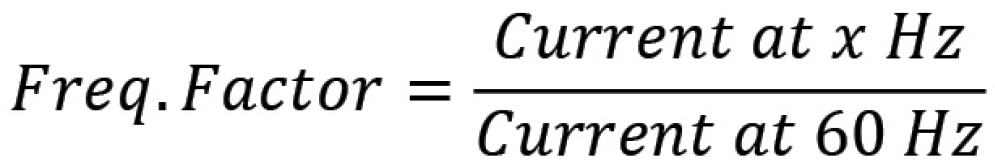
- Adjust the 60 Hz voltage supply to 1 mA through the subject’s arm without a higher frequency component.
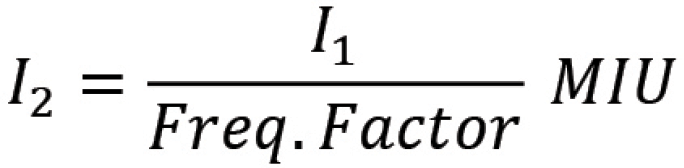
- Add the higher frequency component until the current I2 reached 1.414 mA or a fixed current (in [7], Hart used 1.414 mA). Current is reduced relative to Hart in this study since the test subjects found the 1.414 level difficult to tolerate.
- Record I1 and I2 RMS and peak value.
- Reduce the high-frequency component to zero.
- Increase the 60 Hz current until the test subject reported the same feeling of intensity as the mixed-signal current; record I1 and I2 RMS and peak value.

- C. Dalziel, E. Ogden, and C. Abbott, “Effect of Frequency On Let-go Currents,” AIEE Transactions in Electrical Engineering, vol. 62, pp. 745-750, December 1943.
- UL 101, “UL Standard for Safety for Leakage Current For Utilization Equipment,” 6th Ed., 2019.
- IEC 60990, “Methods of Measurement of Touch Current and Protective Conductor Current,” 3rd Ed., May 2016.
- Hai Jiang, “Study of High-Frequency Spectrum for 120 V Household Appliances,” UL White Paper, April 2023.
- C. Dalziel, and T. H. Mansfield, “Effect of Frequency On Perception Currents,” AIEE Transactions in Electrical Engineering, vol. 69, Issue 2, pp. 1162-1168, January 1950.
- C. Dalziel, J. Lagen, and J. Thurston, “Electric Shock,” AIEE Transactions in Electrical Engineering, vol. 60, pp. 1073-1079, December 1941.
- W.F. Hart, “A Five-Part Resistor-Capacitor Network for Measurement of Voltage and Current Levels Related To Electric Shock and Burns,” Electrical Shock Safety Criteria, Proceedings of the First International Symposium on Electrical Shock Safety Criteria, pp. 183-192, 1985.
- P. Perkins, “What does your touch current look like? Making proper touch current measurements,” IEEE Symposium on Product Compliance Engineering (ISPCE) Measurements, May 2014.
- H. Jiang and P. Brazis, “Experiments of DC human body resistance I: Equipment, setup, and contact materials,” IEEE Symposium on Product Compliance Engineering (ISPCE), May 2018.