

Products can be categorized with respect to Ceff in an FICDM setup because of the direct relation to the peak current for a given test voltage, as described in [4].
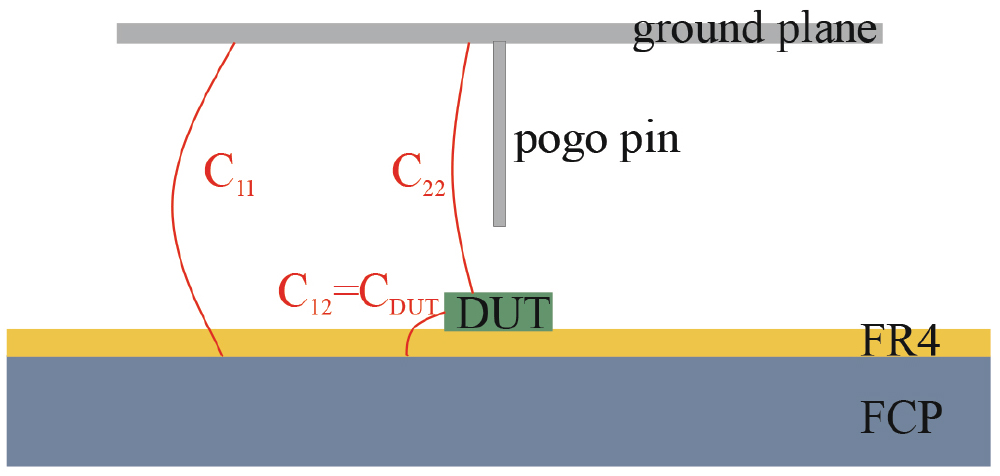

The three capacitance values determine the effective capacitance Ceff. The DUT capacitance CDUT is defined as the capacitance from the device to the field plane. The static capacitance value for CDUT is extracted from a Finite Element Method (FEM) simulation according to the three-capacitances model shown in Figure 1. Differences between Ceff and CDUT capacitances either extracted from FEM-simulation or calculated as parallel plate capacitance Cplate (A is the area of the DUT, and d is the thickness of the FR4 dielectric layer) are demonstrated based on the metallic circular coin modules (height 1.27 mm, diameters see Table 1).
The FEM simulation of CDUT does not coincide with the simple plate capacitor formula since fringing effects are also considered, especially for small devices. CDUT also shows a linear dependency on the area-capacitance relation. In contrast, Ceff values show saturation with increasing area or volume of a DUT. As a result, not only the area of the bottom surface contributes to the capacitance but also the sidewalls and, therefore, the volume.
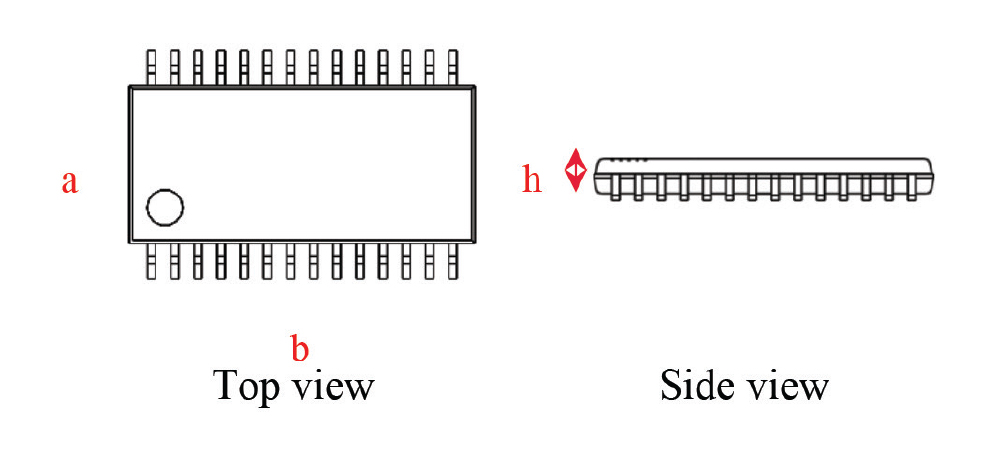
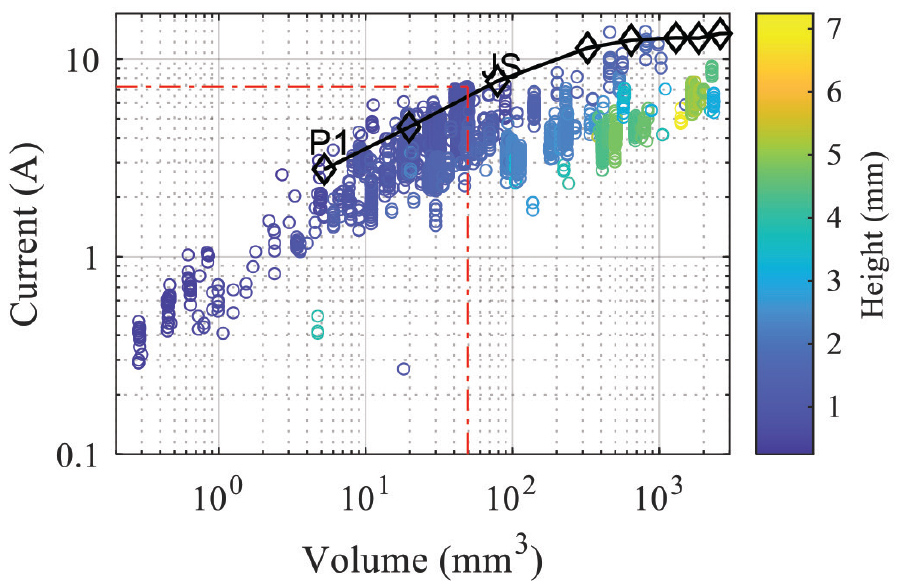
Statistical analysis of CDM testing data shows the relevance of device area and volume for predicting stress current levels in a CDM test since the height h of the device has a non-neglectable influence on the discharge current. A database with over 15 million CDM waveforms has been used to evaluate the relation between area, volume, peak current, and the effective capacitance Ceff. The area and volume of about 10000 different device types can be derived from the package dimensions included in the database. For each device type, only the waveforms are evaluated, showing the maximum positive peak current Ipeak out of several CDM discharges for a positive charging voltage level of 500 V. According to the measurement results, the peak current reduces with the increasing height of the device.

To avoid over-testing, these levels can be lowered based on the second proposal if details of the electrical properties on-package and on-chip are known. Ceff values can be predicted by FEM simulation even before devices are available.
The full paper was published in [6].

- ANSI/JEDEC/ESDA, “Joint Standard for Electrostatic Discharge Sensitivity Testing – Charged Device Model,” JS‑002, 2018
- K. Esmark, R. Gaertner, S. Seidl, F. zur Nieden, H. Wolf and H. Gieser, “Using CC-TLP to get a CDM robustness value,” 2015 37th Electrical Overstress/Electrostatic Discharge Symposium (EOS/ESD), Reno, NV, USA, 2015, pp. 1-10.
- B. C. Atwood, Y. Zhou, D. Clarke and T. Weyl, “Effect of large device capacitance on FICDM peak current,” 2007 29th Electrical Overstress/Electrostatic Discharge Symposium (EOS/ESD), Anaheim, CA, USA, 2007, pp. 5A.1‑1‑5A.1-10.
- N. Jack, B. Carn and J. Morris, “Toward Standardization of Low Impedance Contact CDM,” 2019 41st Annual EOS/ESD Symposium (EOS/ESD), Riverside, CA, USA, 2019, pp. 1-7.
- T. J. Maloney and N. Jack, “CDM Tester Properties as Deduced From Waveforms,” in IEEE Transactions on Device and Materials Reliability, vol. 14, no. 3, pp. 792-800, Sept. 2014, doi: 10.1109/TDMR.2014.2316177
- L. Zeitlhoefler, T. Lutz, F. Zur Nieden, K. Esmark, and R. Gaertner, “Voltage to Current Correlation for CDM Testing,” 2023 45th Annual EOS/ESD Symposium (EOS/ESD), Riverside, CA, USA, 2023, pp. 1-11, doi: 10.23919/EOS/ESD58195.2023.10287735