his article presents an experimental framework to characterize the energy released during thermal runaway events involving Li-ion cells and battery packs used in applications ranging from electric vehicles to consumer electronics and medical devices to aerospace applications. A brief introduction to lithium-ion batteries and battery thermal runaway is provided. The article then describes various methods for obtaining energy release in cells undergoing thermal runaway.
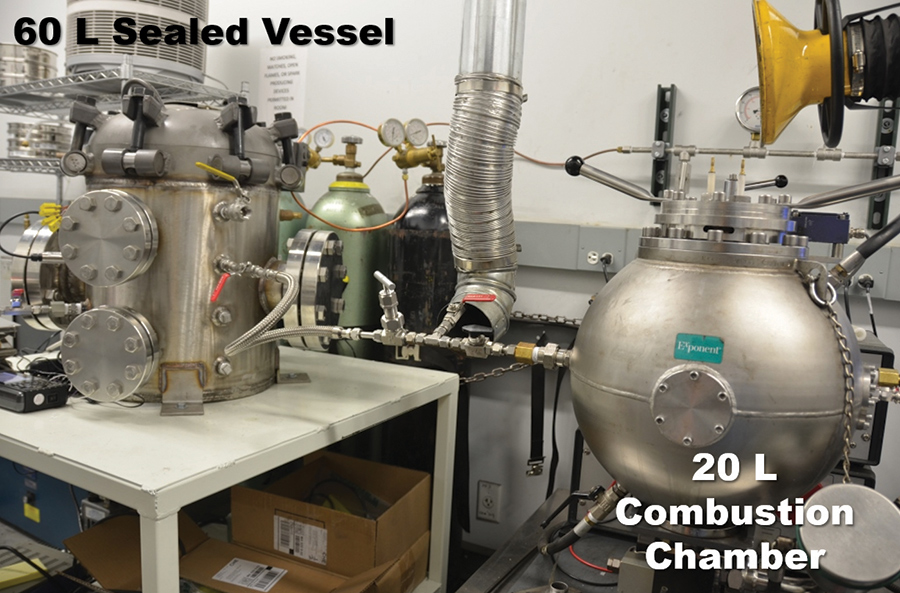
The first method involves testing a cell inside a sealed pressure vessel, which allows for the estimation of the volume of gas produced as a result of thermal runaway and a quantitative assessment of the vent gas composition. This technique is generally used to assess the flammability hazards associated with thermal runaway. The second method described is oxygen consumption calorimetry. This technique provides an estimation of the heat released by a cell undergoing thermal runaway via chemical analysis (i.e., how much oxygen has been consumed and the associated heat release).
The third and fourth methods include two techniques designed to estimate the energy yielded during a battery thermal runaway event: the accelerating rate calorimetry (ARC) and a novel methodology designed to estimate the sensible energy released during a battery thermal runaway failure using a fractional thermal runaway calorimeter (FTRC) apparatus.
One catastrophic failure mechanism that can lead to battery fires is a thermal runaway event. In large, multi-cell packs such as those commonly used in electric vehicles or stationary energy storage systems, the heat generated by one failed cell can heat up neighboring cells which may lead to a thermal cascade throughout the battery pack. It is generally expected that there will occasionally be single cell failures within a population of lithium-ion battery packs. This potential for propagation of failures presents an increased risk to property and safety.
An accurate evaluation of the energy yielded during a battery thermal runaway failure is of critical importance for the design of any battery-powered product from both safety and performance standpoints. Accurate energy yield estimates are valuable for a large variety of tasks, including but not limited to:
- Comparisons of failure characteristics of batteries from different formats and vendors;
- Evaluation of the ultimate fate of the energy released (i.e., is the heat released contained within the vented gases or in the cell body);
- Design of safer battery packs that minimize the likelihood of cascading failure events involving neighboring cells; and
- Create reliable inputs for mechanical or thermal models of devices or battery packs.
The energy released during a battery thermal runaway failure can roughly be assessed by evaluating the sensible energy and chemical energy components that evolved during the event. The sensible energy components can be evaluated by estimating the amount of energy required to increase the temperature of the cell body, gases, and ejecta to the levels experienced during a thermal runaway failure (prior to any combustion event occurring).
The chemical energy component can be assessed by estimating the energy released by the combustion of the vent gases following their release from the cell body during the thermal runaway event. The characterization of the combustion energy requires a characterization of the composition and amounts of vent gases released during the failure event.
The following sections provide an overview of a battery thermal runaway failure as well as a number of techniques that can be used to characterize the energy yielded during a battery failure and its components.
- External heating from a high ambient temperature, thermal abuse, or external fire;
- A defect inside the cell that results in an internal short circuit, which causes the cell to heat up at the location of the defect;
- A surge in the charging or discharging current. When cells are charged or discharged, heat is generated. The higher the current, the higher the heat generation;
- An improper electrical connection at the tab of a battery. This causes an increased electrical resistance which generates heat at the electrical contacts;
- Mechanical damage to the cell or battery that can also lead to internal shorts and result in heat generation.
During a thermal runaway event, the cell produces gases that build up within the cell. Some cell designs (e.g., cylindrical cells) include one or more designed vents that open to release the gases. In some cases, these vents can become obstructed or may not be able to adequately vent gases, which may result in rupture of the cell enclosure. Other cell form factors, such as pouch cells, often do not include a specific vent and the gases will release at weak points in the external pouch, typically near the tabs of the cell or along the pouch seams in unconstrained cells.
We previously produced a paper outlining the methodology for this type of testing [3]. The results presented were relative to small format Li-ion pouch cells (7.7 Wh nominal, 2.1 Ah, 3.7 V) even though both the testing and analytical methods presented could be similarly applied to larger format cells. The cells consisted of a negative electrode with graphite active material and a positive electrode with LiCoO2 active material. Note that cell chemistry, cell geometry, ambient atmosphere, as well as the way the thermal runaway process is initiated all influence the quantitative behavior of the failure.
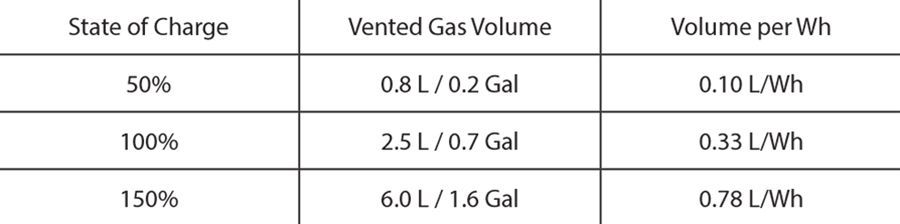
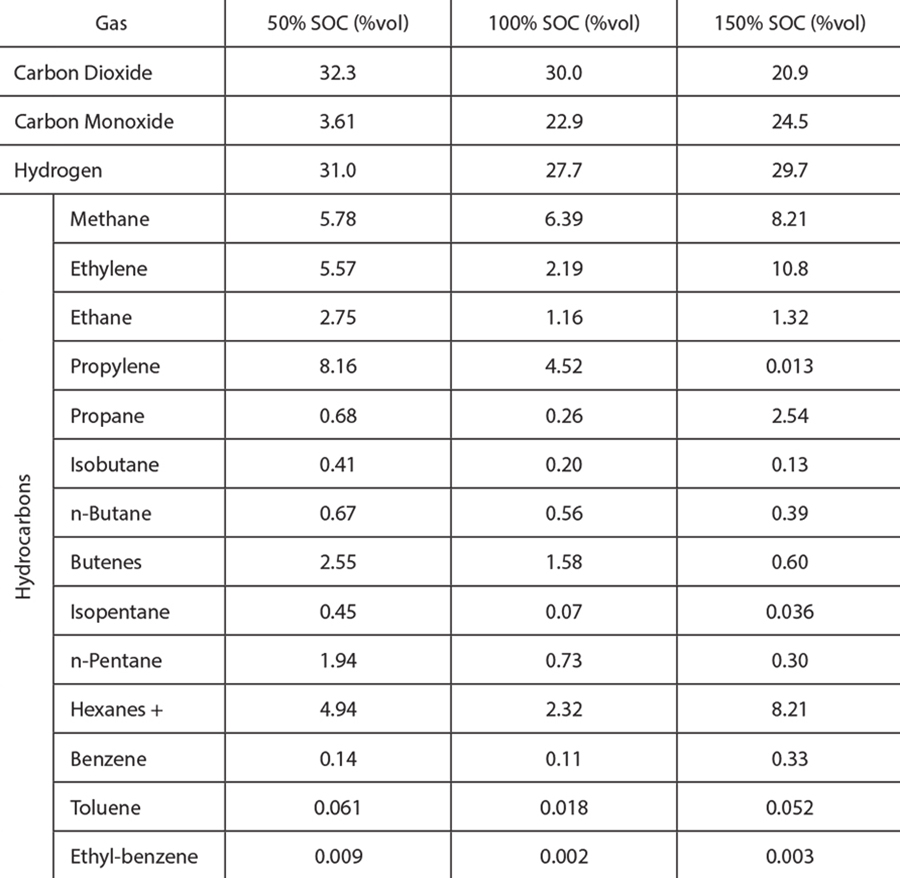
Table 1 summarizes the amount of gas vented during a thermal runaway event for pouch cells at three different states of charge (a more detailed description can be found in [1]). For comparison, the volume reported is referenced to standard pressure and temperature. It should be noted that for large battery packs, the amount of gas that is released can be substantial.
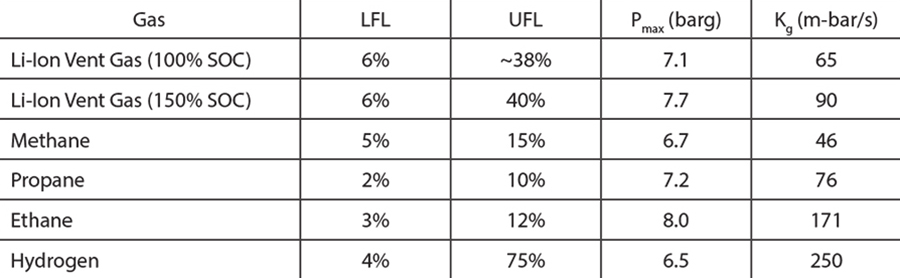
Table 1 and Table 2 show (1) the vent gas volume as a function of the cell SOC, and (2) the gas composition for different SOCs, respectively. With the exception of carbon dioxide, all the substances reported in Table 2 are flammable. In addition, carbon monoxide and some of the hydrocarbons are not only flammable but can also pose significant health hazards.
Note that Table 2 summarizes the species volume fraction of the vent gases. The absolute volume of each species depends on the total volume of gas vented, which increases as the SOC increases. Therefore, the total volume of hydrogen released from a 150% SOC cell is significantly higher than from a 50% SOC cell, despite having similar hydrogen volume fractions.
The standard method by which the cone calorimeter results are processed is sometimes modified to account for the complex composition of a Li-ion cell. A detailed description of the challenges associated with performing calorimetry of Li-ion cells is discussed in [5]. Often, the combustion event does not only involve the combustion of the vented gases, but solid components of the cell itself also burn and release energy.
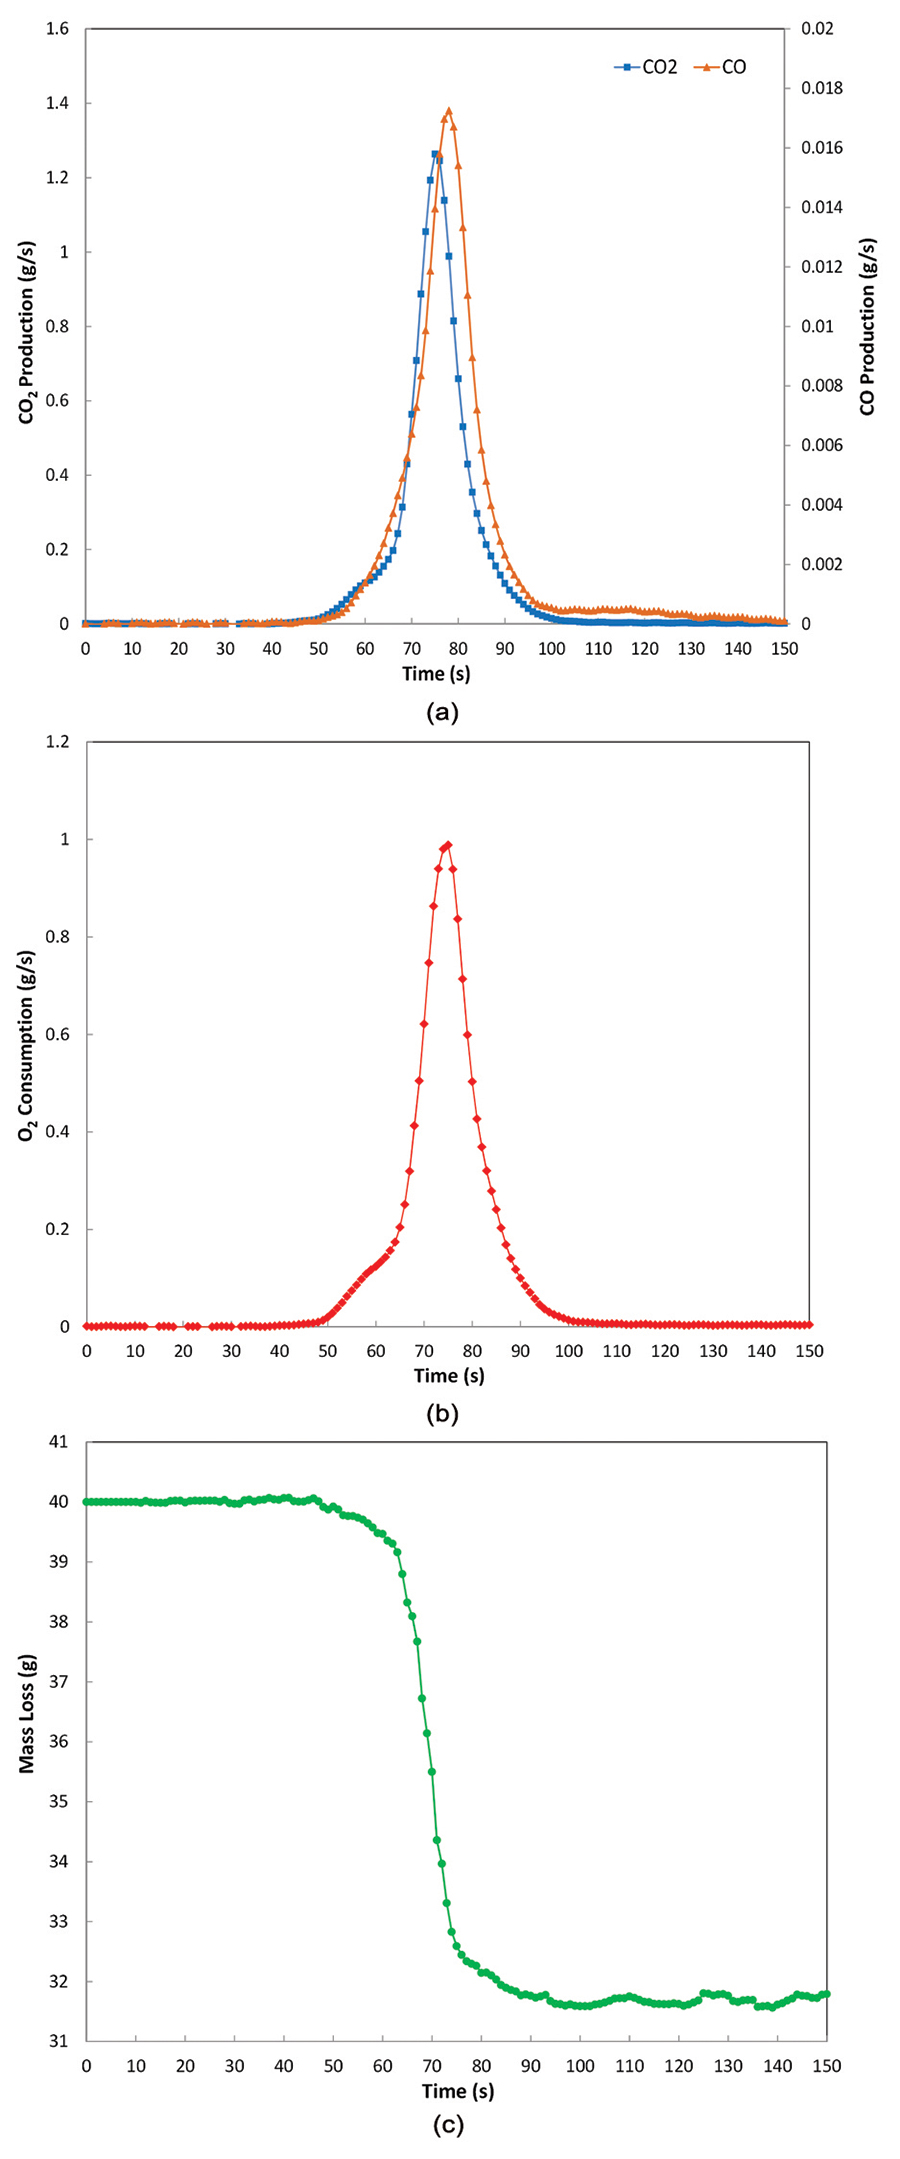
After the 1st phase, a transition to faster reaction kinetics is observed at approximately 65 seconds. Increases in the CO2 and CO production rates combined with a rise in oxygen consumption areshown on Figure 2a., 2b., and 2c. This large increase is confirmed by changes in the slope of the production, consumption, and mass loss rate curves. At this stage, the bulk material within the cell is involved in the combustion process. This 2nd phase lasts for approximately 35 seconds before extinction occurs. The peaks of CO2 and CO are respectively 1.3 and 0.02 g/s. The total mass loss at the end of the test is about 8.4 g. This mass loss compares to the total mass of organic compounds present in the Li-ion cell and is evaluated to be approximately 9.0 g.
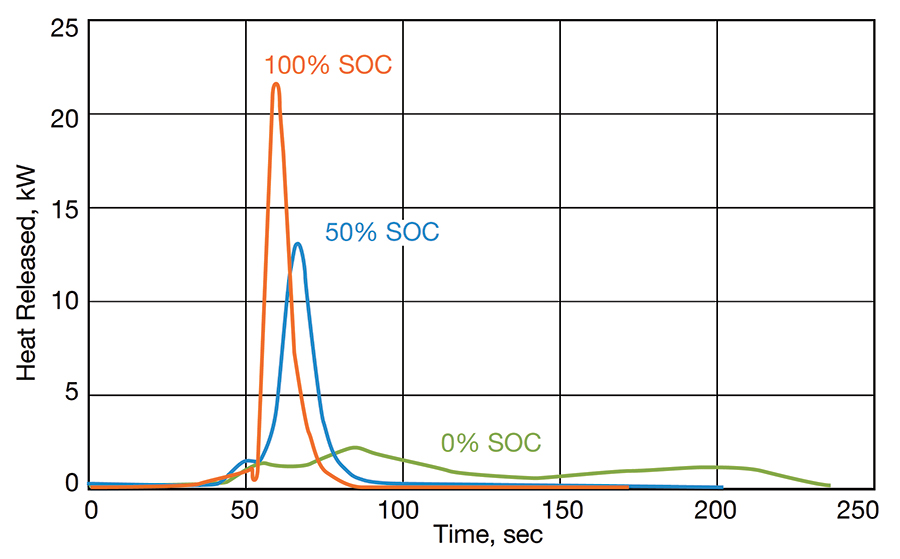
Although the cone calorimeter can be used to determine several parameters (e.g., critical heat flux for ignition, ignition time, etc.), one of the most important parameters measured is the heat release rate (HRR). The HRR is the amount of energy produced by the combustion process per unit of time (expressed typically in kW). It is the single most important parameter for determining the fire hazards associated with a given material or product and for designing fire protection systems. Figure 3 shows the evolution of the heat release rate as a function of time for a 7.7 Wh Li-ion cell at 0%, 50%, and 100% SOC. At the peak of the combustion event, the fire releases approximately 22 kW, 13 kW, and 2 kW of power for cell SOCs equal to 100%, 50%, and 0%, respectively. Once again, the heat release rate is very dependent on the state of charge of the cell.
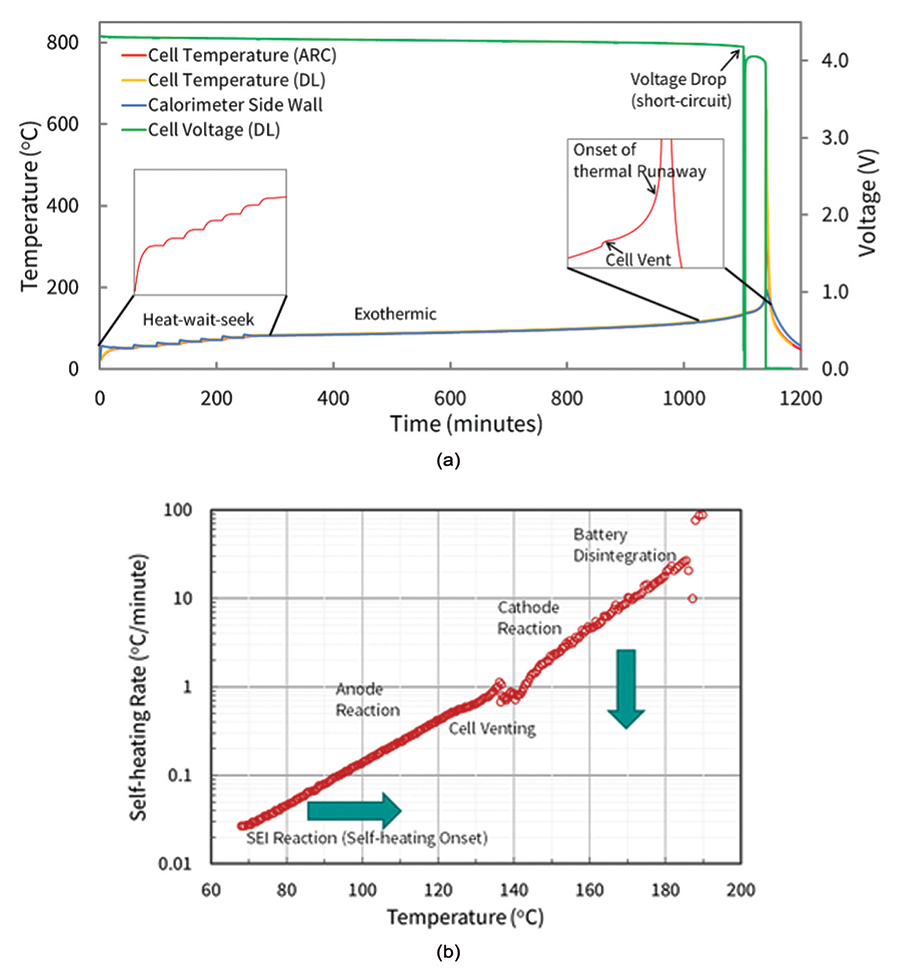
In ARC testing of batteries, the protocol typically follows a heat-wait-search (HWS) algorithm that minimizes heat losses from the sample to the surroundings. More specifically, the ARC system and sample are first heated to a set temperature point and are independently monitored for temperature. Both are then allowed to wait to equilibrate temperatures for a set amount of time, before actively searching for temperature rise from the sample. If no sample self-heating is detected, the system moves to the next temperature step, typically 5 °C or 10 °C, and begins the H-W-S process again.
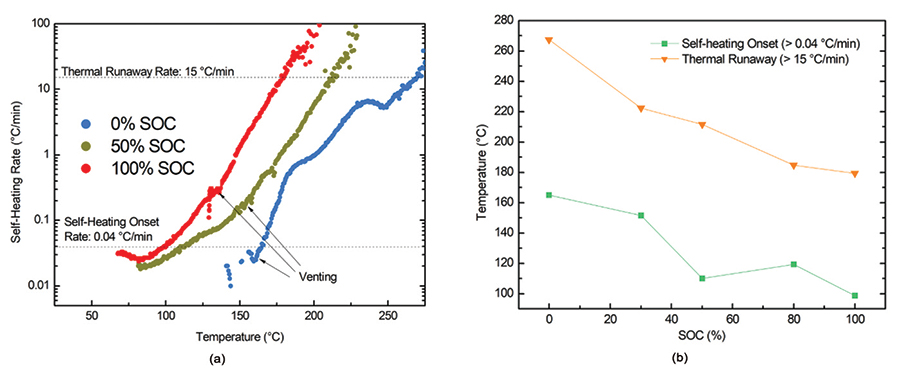
Once the system detects self-heating of the sample during a search step, the system increases its temperature to match the sample temperature, thus creating an adiabatic environment. This temperature tracking continues until the cell thermally fails or a designated temperature set point is reached. Evaluating the self-heating as a function of temperature, cell voltage, and sometimes the evolved gas/pressure for ARC tests in a sealed vessel allows for analysis of various chemical reactions and events that occur during thermal failure of a cell. These include solid electrolyte interface (SEI) decomposition, electrolyte venting from cell enclosures, separator failure and/or shut-down, positive electrode oxidation, and more (see Figure 4).
An FTRC apparatus equipped with a standard 18650 cell chamber is fundamentally a symmetric device that can evaluate energy released associated with cell failures encompassing top venting, bottom venting, or both. The operation of the FTRC rests on simple physical principles. The various assemblies of the FTRC are all composed of known materials with known masses. The temperatures of these components are recorded throughout a test run. Since the material composition of the assemblies is well known, it is known how much energy must be added to the assemblies to cause a given rise in temperature. Thus, by measuring the component temperatures, it is simple to compute how much energy was transferred to those components (i.e, how much energy the cell released).
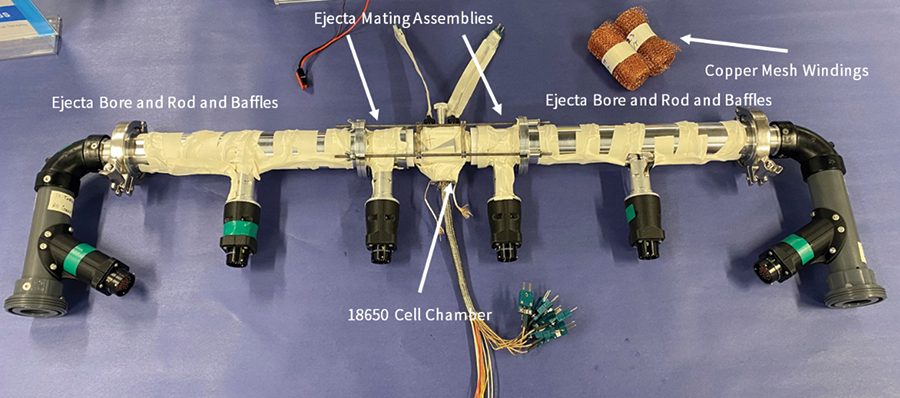
The energy evolved during the battery failure can be evaluated in terms of total energy yield, fractional energy yields associated with the battery body, and positive/negative vent gas and ejecta. The cell energy yield is obtained by solving an energy balance equation for all the sub-components of the calorimeter based on the mass, specific heat, and temperature increase experienced by each sub-assembly. More specifically, the sub-assembly temperature increase is measured by over 100 type-K thermocouples attached to the hardware of the calorimeter in multiple locations.
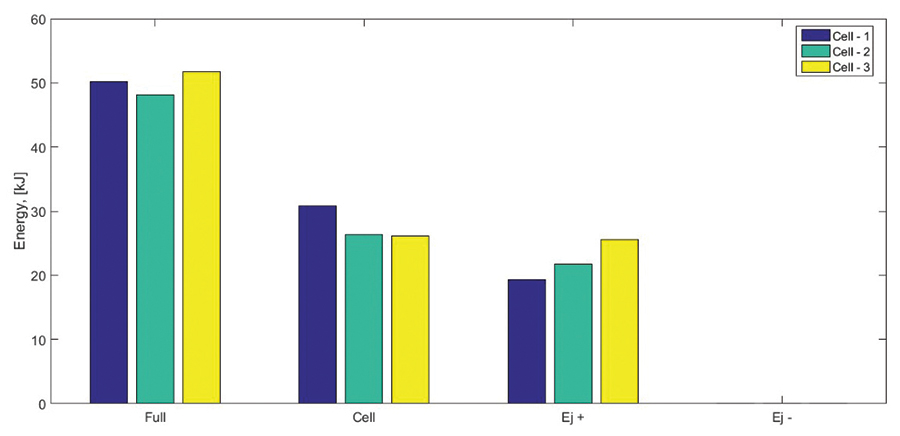
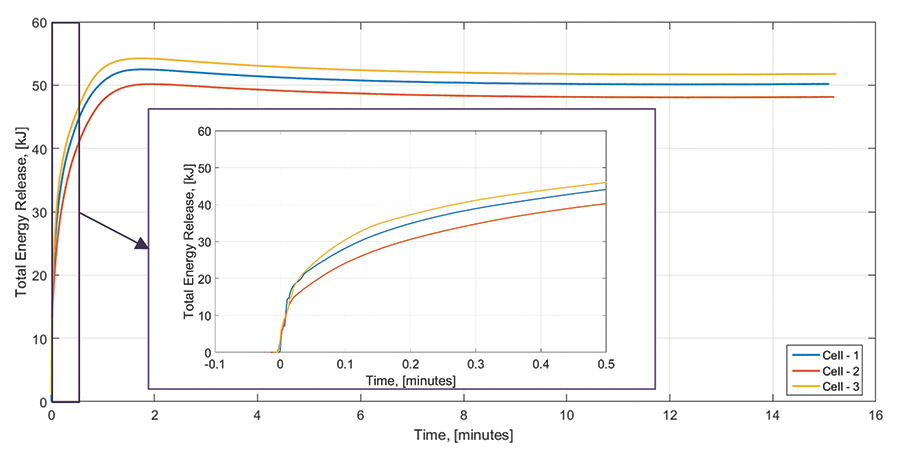
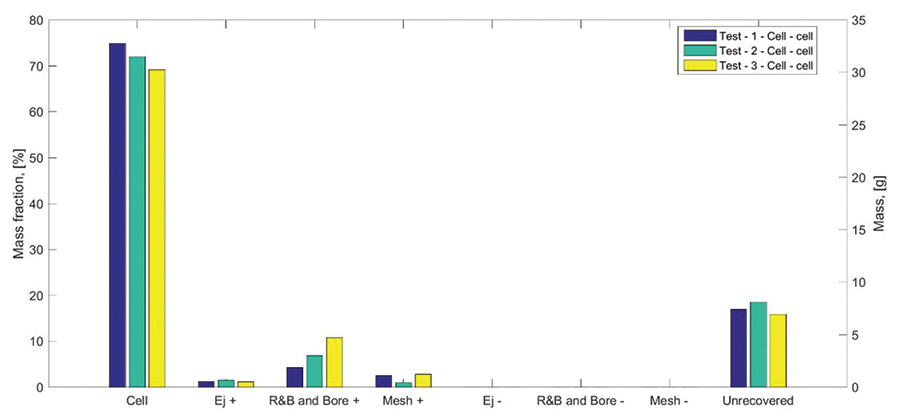
Examples of energy yield estimations associated with battery thermal runaway events is presented in Figures 7, 8, and 9. We performed triplicate FTRC tests on 18650 cells with a capacity of 2.6 Ah and a state-of-charge of 100%. Figure 7 shows a bar plot depicting the total energy yield that evolved during a thermal runaway event of the three subject cells. The testing results show a total energy yield ranging between approximately 48 kJ and 52 kJ. The yield fractions associated with the cell body range between 26kJ and 31kJ and those associated with the positive vent gas and eject range between 19 kJ and 26 kJ. Figure 8 shows the time-dependent evolution of energy yielded by the cell failure as measured by the calorimeter apparatus. Figure 9 shows the fractional mass distribution measured during the tests.
The results show that the vast majority of the mass remains within the cell body following the thermal runaway event. Smaller mass fractions were associated with the ejecta that were accumulated along the positive side of the calorimeter (i.e., in the positive ejecta mating, copper mesh, rod-and-baffles, and bore). Virtually no mass (or energy) was released towards the negative portion of the calorimeter that interfaces with the bottom of the cell.
- Somandepalli, V, Marr, K, and Horn, Q, “Quantification of Combustion Hazards of Thermal Runaway Failures in Li-ion Batteries,” SAE International Journal of Alternative Powertrains, 3(1):2014.
- Colella F., Ponchaut N.F., Biteau H., Marr, K., Somandepalli V., Horn Q.C., Long, R.T., “Characterization of Electric Vehicle Fires,” Proceedings of the 16th International Symposium on Aerodynamics, Ventilation & Fire in Tunnels, 15-17 September 2015, Seattle, WA.
- Colella, F., Marr, K., Ponchaut, N., Somandepalli, V., Spray, R., “Analysis of Combustion Hazards due to Catastrophic Failures in Li-ion Battery Packs,” 7th International Seminar on Fire and Explosion Hazards, 5–10 May 2013, Providence, RI.
- The SFPE Handbook of Fire Protection Engineering, 4th Edition, Society of Fire Protection Engineers, 2008.
- Somandepalli, V., Biteau, H., “Cone Calorimetry as a Tool for Thermal Hazard Assessment of Li-Ion Cells,” SAE International Journal of Alternative Powertrains, 3(2):2014.
- Walker W., et. al. “The Effect of Cell Geometry and Trigger Method on the Risk Associated with Thermal Runaway of Lithium-ion Batteries,” Journal of Power Sources, 524, 2022.