spectrum analyzer measures power (default) or voltage versus frequency. Most digital harmonic emissions occur in the range 10 kHz to 1 GHz and this defines the minimum frequency range for spectrum analyzers. Some harmonics may even extend up to 3 GHz. Two types of harmonic emissions will be observed: narrowband and broadband. Many times, you’ll see a combination of the two.
Optional settings might include activating a built-in low-noise preamplifier (if included), which helps lower the measurement noise floor and reveal smaller harmonics.
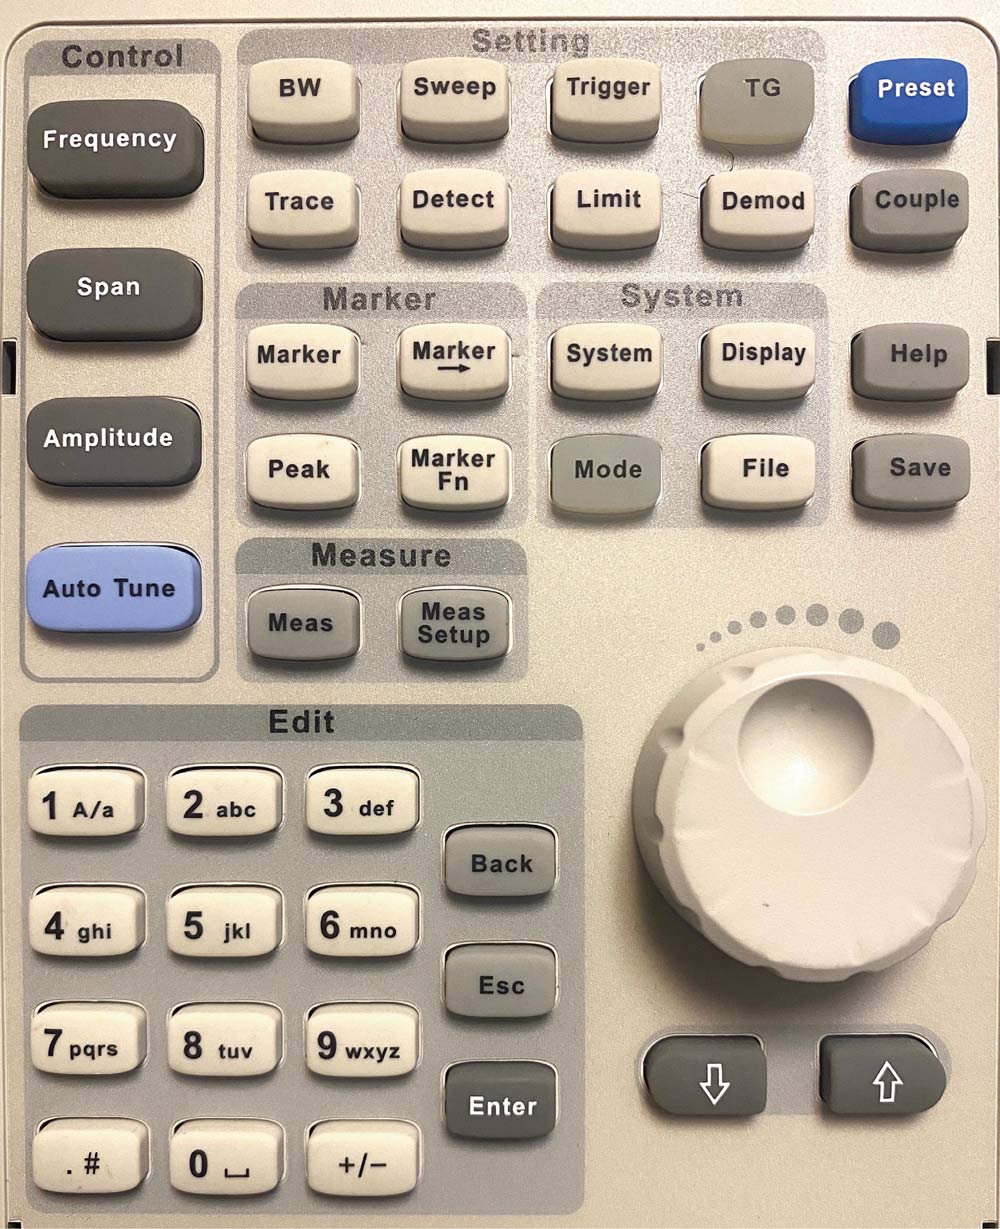
I also like to switch from the default “dBm” (power) vertical units to “dBµV” (voltage), which matches the units used in the compliance limits. You may find this under the Span button. You’ll probably want to readjust the Reference Level when changing units to make the 10 dB steps line up with the vertical divisions. You may need to readjust several of these settings to obtain a centered sweep on the display.
Conducted Emissions – Conducted emissions (CE) are the harmonic emissions being conducted out the power cable on products. According to most commercial standards, the analyzer should be set to Start and Stop frequencies of 150 kHz to 30 MHz. The RBW should be set to 9 kHz. However, many stock analyzers may not have the ability to be set to 9 kHz. For troubleshooting purposes, 10 kHz is sufficient.
To measure CE accurately, you’ll need a line impedance stabilization network or LISN. If you don’t already have one available, I recommend the Tekbox TBCL08, an 8-amp LISN designed for line-operated products, or the TBOH01 10-amp LISN designed for DC-powered products. You’ll need a pair of these DC LISNs in order to measure the positive and return power wires separately.
When I perform benchtop troubleshooting, I’ll tape down sheets of heavy-duty aluminum foil over the top. The LISN (or DC LISNs) should be bonded to this ground plane so common mode currents can return back to the LISN. The product under test is also placed on this ground plane. See Reference 1 for more detail.
Option: In order to measure differential- and common mode harmonic currents separately, Tekbox sells a product called “LISN MATE” (model TBLM01) that separates the two. Knowing which is the dominant harmonic noise current helps determine what kind of filter topology would be beneficial. See Reference 2 for more information on these measurements and the appropriate filter design to use.
Radiated Emissions – Radiated emissions (RE) are the harmonic emissions being radiated from the product under test. According to most commercial standards, the analyzer should be set to Start and Stop frequencies of 30 MHz to 1 GHz. The RBW should be set to 120 kHz. However, many stock analyzers may not have the ability to be set to 120 kHz. For troubleshooting purposes, 100 kHz is sufficient.
For troubleshooting purposes, I use an uncalibrated antenna placed nearby, as described in Bench Notes 2. Space the antenna about 1m away from the product under test. I usually place the antenna and analyzer about 1m apart (not critical) while manipulating cables, adding ferrites, or mitigating leaky seams. So long as you can observe the emissions in real time, you will be able to assess various mitigations quickly. See Reference 3 for more detail.
I often find most narrowband harmonics tend to be dominant between 50 and 250 MHz, so once I see the “big picture” from 30 to 1 GHz, I’ll often reduce the Stop frequency to 300 or 500 MHz so the sweep time is faster. Also, concentrating on mitigating the lower harmonics first will usually do the same for the higher harmonics if related to the same source.
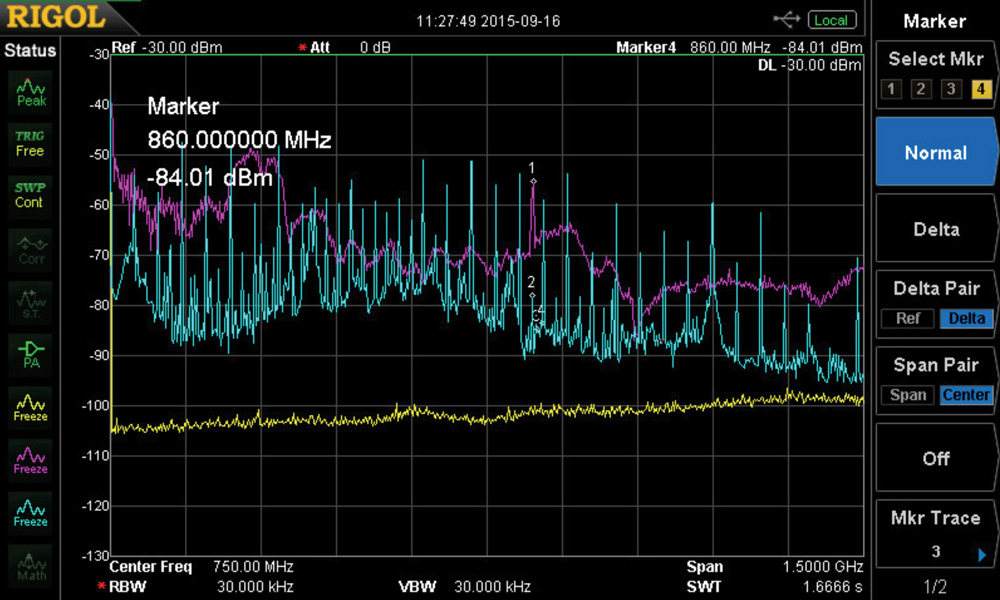
Measurement Noise Floor – I almost always use Trace 1 to display the measurement noise floor. This helps to visually observe the amplitude of harmonic signals being measured. Disconnect the antenna. You’ll normally see these trace controls under the Display button. Press Display > select Trace 1, and then press Max Hold. This will build up several sweeps. Pressing Store or Freeze will store that trace on the display.
Ambient Measurement – When measuring outside a shielded room or chamber (typically with an RF current probe or antenna), chances are you’ll pick up ambient signals from broadcast radio, two-way radios, DTV, or cellular signals. It’s instructive to display the ambient spectrum usage with the product under test Off. This will display the measurement noise floor, plus any active ambient signals. Selecting another trace with the Product On will take the actual measurement of the product emissions, and you should observe frequencies where the product under test is emitting in between the ambients.
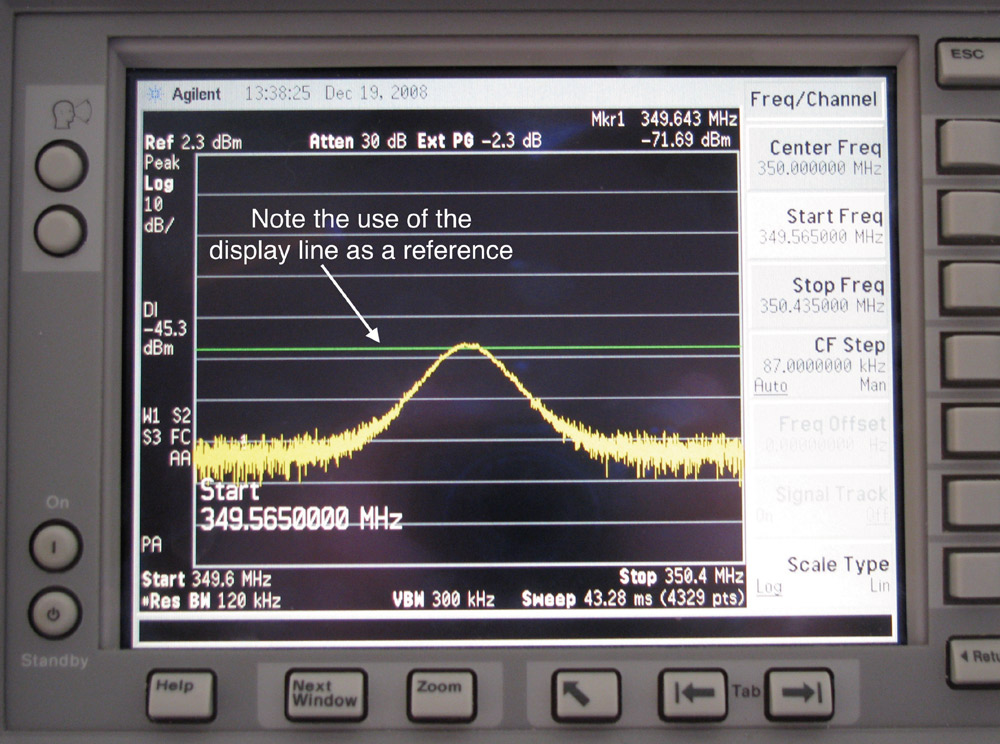
Display Line – Many analyzers have the means to add a horizontal line at an arbitrary amplitude. This is useful when troubleshooting by placing the line at one of the dominant harmonics while you’re trying different mitigations. This makes it easy to visually see whether you’re making progress or not (Figure 3).
Using Markers – Markers are useful for identifying specific harmonics or resonant peaks. There will likely be up to two Marker buttons: one to select particular markers and one to automatically find the highest peak or “Peak Left/Right.” I also use markers on adjacent narrowband harmonics to confirm the fundamental clock as the difference frequency. Some analyzers can display six or more markers, and some can display a Marker Table or otherwise display all the marker amplitudes and frequencies.
Alternatively, some of the more recent digitizing oscilloscopes have built-in advanced spectrum analysis features. Examples include the Rohde & Schwarz RTE, RTO, and MXO series, and the Tektronix Series 4/5/6. They can simultaneously display independent time and frequency domain traces. This ability is quite useful for EMI debugging, where you can relate specific portions of the time domain to a frequency spectrum.
- Wyatt, Workbench Troubleshooting Emissions, Volume 2, Chapter 3.
- Wyatt, Review: Tekbox LISN Mate is valuable for evaluating filter circuits, EDN.
- Wyatt, Workbench Troubleshooting Emissions, Volume 2, Chapter 4.