

CDE Modeling Using Star-Tree Impedance Networks for USB2 Cable
revious studies of cable discharge events (CDE) have often used oversimplified models of the cable, such as a single 50Ω transmission line. This is not bad for an initial investigation, but the next level of detail is not difficult to capture for some familiar data cables. This work focuses on a star-tree impedance model for the 5-node USB2 cable and outlines a methodology for treating other cables, such as USB3 and HDMI.
The Cable Discharge Event (CDE) is an important ESD topic of continuing interest [1,2]. But to quantify CDE and observations, a simple and accurate electrical model of the cable itself is needed for future studies of on-silicon ESD protection optimizing for cost performance and improved reliability. Industry specifications leave much latitude at the expense of clarity. After considerable study and to promote understanding, we devised simple, lucid models for USB2, USB3, and HDMI cables based on star and tree networks [3]. These utilize measurements of capacitance and propagation velocity (and therefore inductance and impedance) that give models with reduced parameter count and agree well with the experiment. In this brief article, we model the five-node USB2 cable (Figure 1) and plan to cover similar models for USB3 and HDMI in the 2024 EOS/ESD Symposium.
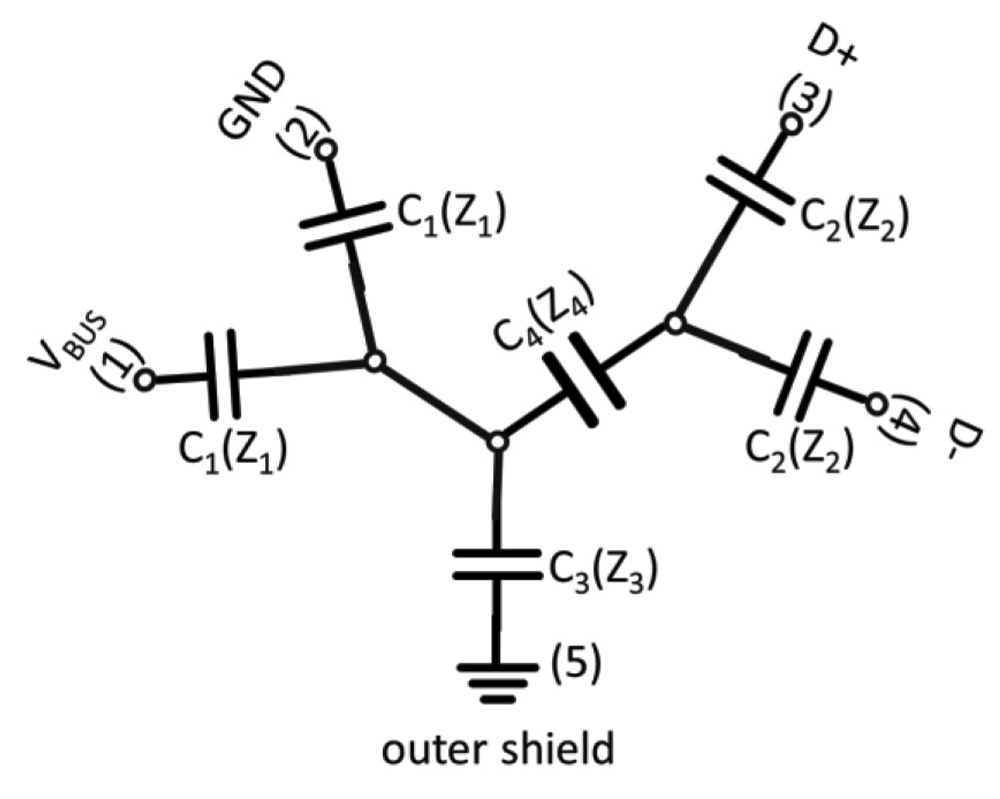
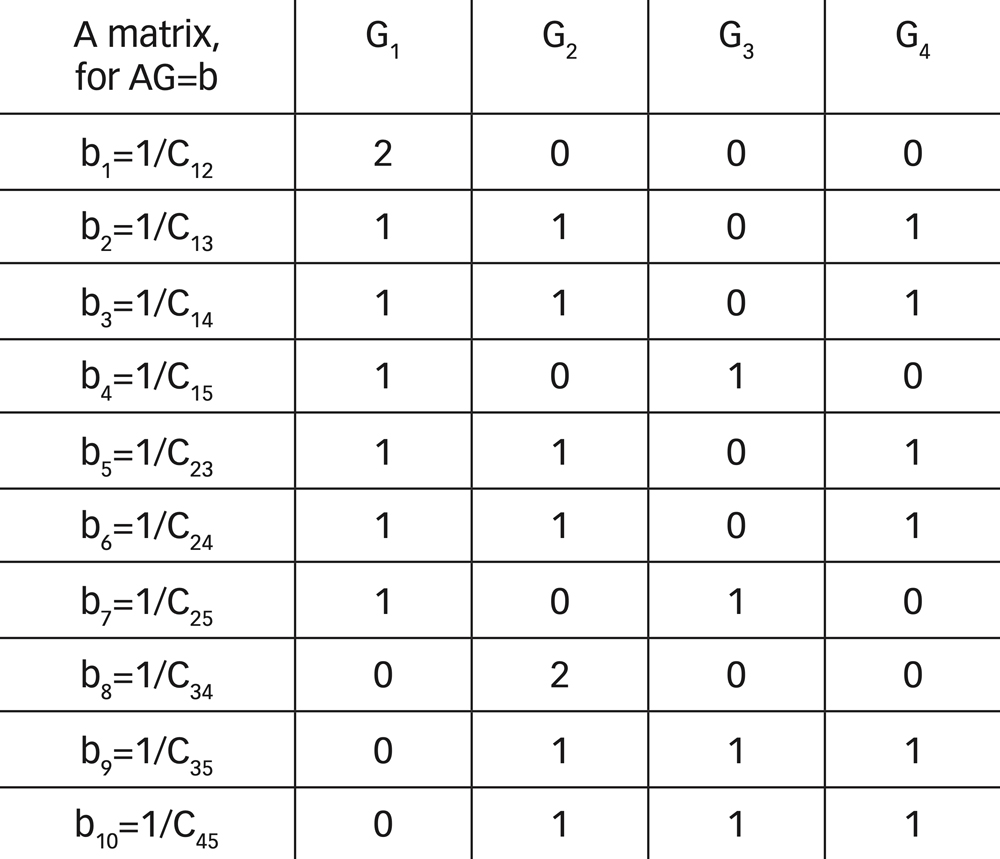
The final model will be transmission line impedance Z that captures both capacitance and velocity measurements, as Z=L/C and inductance L are derived from velocity v=1/LC, as discussed below. (C and L quantities are per unit length.) Let conductance G=1/C here, as it is the capacitive reactance with j/w normalized out as unity. Then, we can easily formulate a matrix describing the summed G elements corresponding to the ten pairwise (reciprocal) capacitance measurements between the numbered nodes in Figure 1. Linear regression using matrices, as below, solve for the four parametric values of (reciprocal) capacitance, whereupon we use measured velocity v to solve for each Z, Z1-Z4.
Let Ci be a column vector of parametric capacitances for the model in Figure 1.

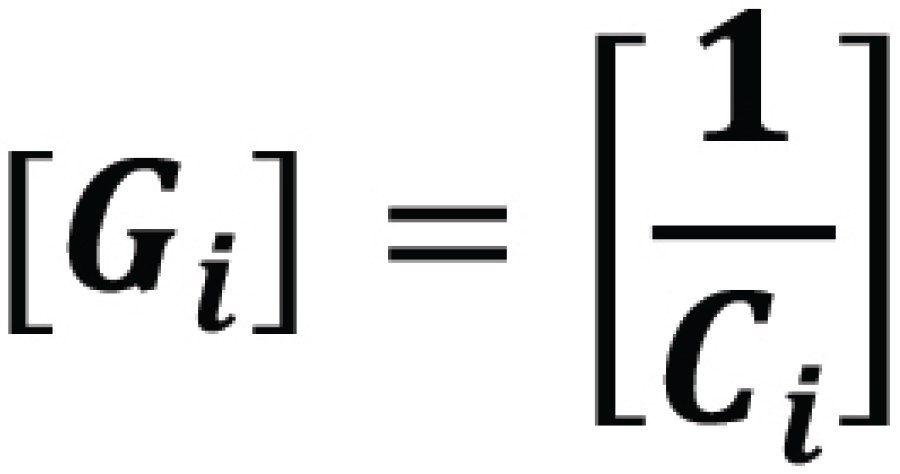





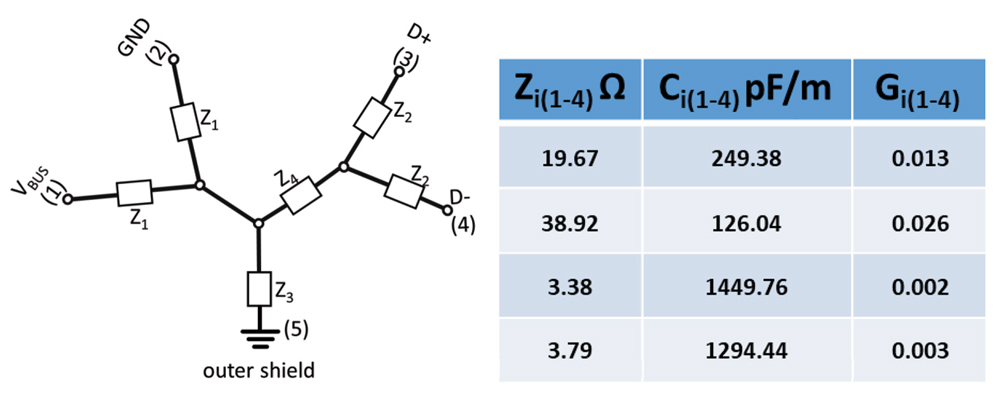
The four C values Ci, derived from the G solution, are converted to transmission line impedances (Zi) once we have a propagation velocity Vp. Figure 2 shows Z1Z4 values, found from C1C4 using

The D+/D- twisted pair impedance 2Z2 = 77.84 ohms is within the USB2 spec limit of 90 ohms ±15%. For CDE problems, the capacitive DC limit, Figure 1, is used to describe initial charge storage, and the full impedance model of Figure 2 plus line terminations and switching can be used to determine the sequence and timing of CDE pulses. The Figure 2 network is comprehensive enough to describe line coupling in terms of even and odd mode impedances that can be written down by inspection, with Z3 and Z4 playing major roles. [4] Note that the twisted pair lines are more strongly coupled than the power lines, as desired. This comprehensive USB2 cable model is, of course, applicable beyond CDE and, for example could allow a quick grasp of USB2 signal integrity issues.
References
- S. Marathe, P. Wei, S. Ze, L. Guan, D. Pommerenke, “Scenarios of ESD Discharges to USB Connectors,” 2017 EOS/ESD Proceedings, 3A.4.
- M. Coenen, “Cable Discharge Event (CDE),” Interference Technology, July 31, 2019.
https://interferencetechnology.com/cable-discharge-event-cde - https://en.wikipedia.org/wiki/Star-mesh_transform
- See Maloney and Poon, 2004, https://bit.ly/3z7BTVe, and references therein.