


igh-speed interfaces are essential to satisfy the need for processing massive amounts of data. In all market segments, from consumer and computing to industrial and automotive, the trend is to introduce innovative technologies or to increase the data rate of existing interfaces to reach gigabit speeds. The computing segment usually leads the race for higher data rates. Just recently, the USB standard was extended to support 80Gbps with its latest revision USB 4.2. In automotive ethernet applications, the data rate will increase up to 25Gbps over a single differential pair.
The extremely high functional density of physical layer (PHY) circuits for all these high-speed interfaces usually does not allow robust on-chip protection against electrostatic discharge (ESD). That is why external ESD protection devices are used to fulfill the system’s ESD requirements. Besides the ESD requirements, all high-speed interfaces need to fulfill the requirements on signal integrity (SI). The ESD device itself introduces a discontinuity into the interface and might violate the limits of SI.
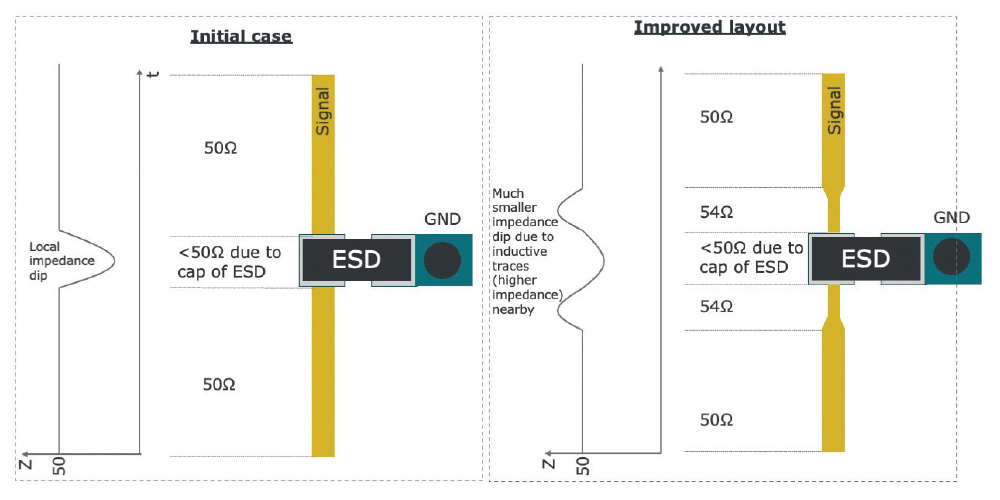
From the microwave theory’s point of view, the increase of the impedance means that trace becomes more “inductive,” which in our case can compensate for the capacitance of the ESD protection device. In the impedance profile, it can be observed that the microstrip line pushes the impedance at the ESD device back to the targeted system impedance, e.g., 50 Ω, as shown in Figure 1b.
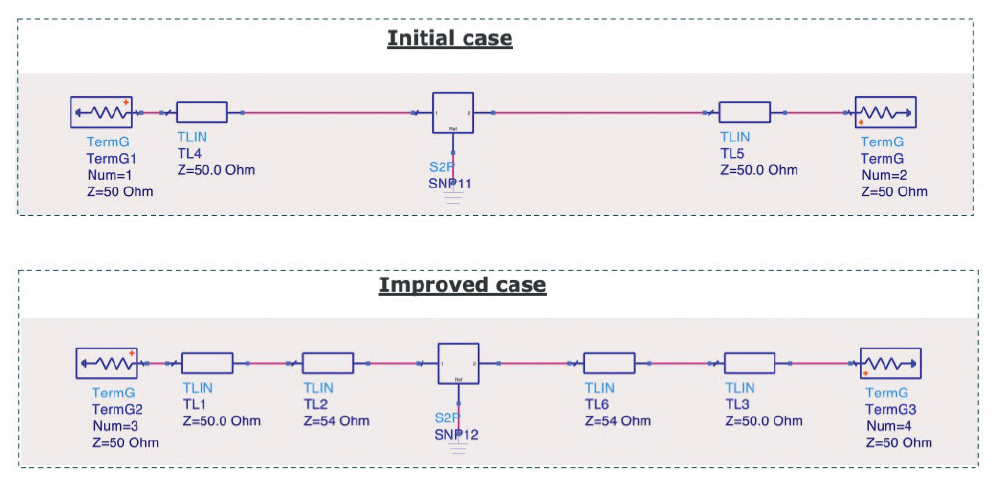
To verify the theoretical considerations which were presented before, two simulations were performed in Keysight ADS using built-in transmission line models and measured scattering parameters (S-parameters) of a real ESD device. The setups for both cases are shown in Figure 2.

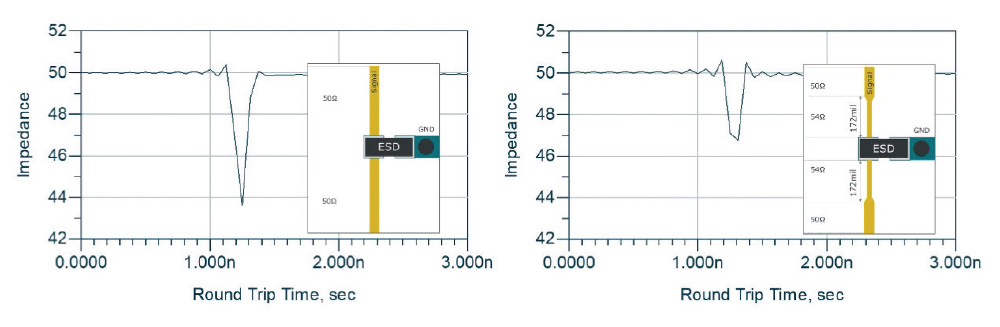
Example designs of 50 Ω microstrip lines that can accommodate the aforementioned package are shown in Figures 3a and 3b on page 26. Simulating the impedance profile using TDR with a rise time of 100 ps for these components results in the graphs in Figure 3a. It shows an impedance drop down to 43.5 Ω, which is caused by the ESD protection device. This can be a violation of the SI limits for some sophisticated applications such as HDMI.
Based on the concept introduced before, a short section of the transmission lines on both sides of the ESD device is tuned to an impedance of 54 Ω. The resulting microstrip line dimensions are shown in Figure 3b. A simulation of this design yields an improvement of the overall impedance profile as can be seen in Figure 3b. The impedance drop can be successfully reduced from roughly 43.5 to 47 Ω which is typically within the SI requirements.

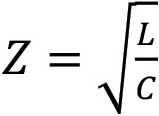
To find the optimum length, we refer to the impedance equation for a typical transmission line, as shown in Microwave Engineering by Pozar, Fourth Edition, p 148:
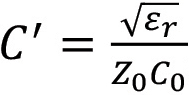
In our specific example, we see that our impedance in the TDR drops down to 43 Ω. The capacitance per length for a 43 Ω microstrip line is 0.14 pF/mm. With 0.3 pF of added ESD device capacitance, this leads to an equivalent microstrip line length of 2.1 mm (86mil).
We can now take this value to estimate the length of the higher impedance trace which we want to add to compensate for the capacitance. Based on our experience, it is most efficient to take roughly double the length, which is then 4.2 mm (172 mil). As outlined in Figure 3b, the resulting microstrip line has one impedance-adjusted section of the calculated length before the ESD protection footprint and one behind it.
It should be mentioned that the length of the microstrip line section tuned to 54 Ω should not be too short to be efficient but also not too long due to reflections when the added piece of microstrip is in the range of the wavelength. In our case, the wavelength at 7 GHz for a microstrip is roughly 79 4mil (20 mm). We estimated 172 mil, so we are in an acceptable range without expecting any reflections in this frequency range.
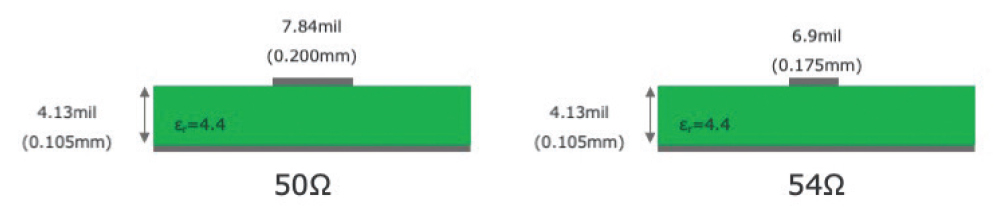
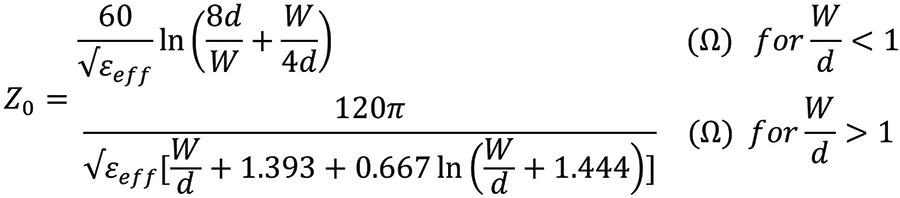
Without a doubt, the main advantage of this method is its simple way of implementation. To achieve an increased transmission line impedance, just a slight reduction of trace width is needed. An example is shown in Figure 4 based on a microstrip configuration in FR4 (εr=4.4). In order to realize the intended tuning, the trace width needs to be reduced by roughly 1 mil (0.025 mm). All other parameters can be left untouched. This easy-use fact makes this method very easy to implement and, hence, very effective. There are many tools for calculating the trace impedance which are available to all users for a broad range of uses.

To focus once again on the length of the additional trace. Figure 6 compares the S-parameters between the initial case and a modified case where the additional trace is too long, which means that it is 800 mil (ca 20 mm) which corresponds roughly to 1λ. The IL is dropping at some frequencies (@4 GHz and 8 GHz) and the RL is increased correspondingly. From the microwave theory point of view, when we increase the length of the high impedance trace, we observe that more reflections stepping into the frequency range of interest decrease the SI performance of the link.
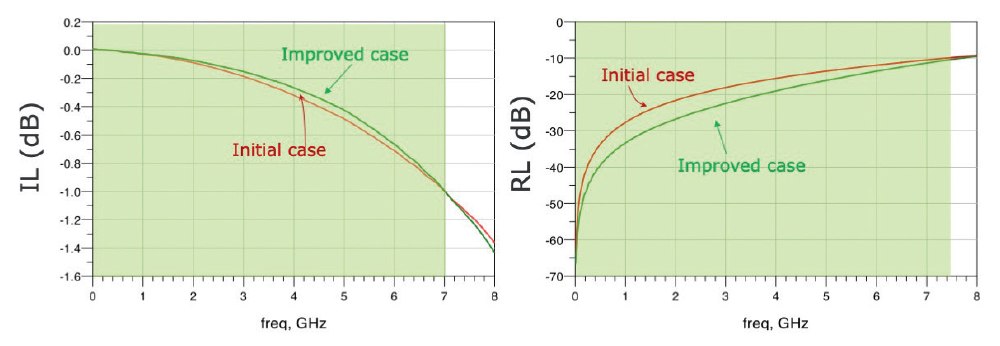
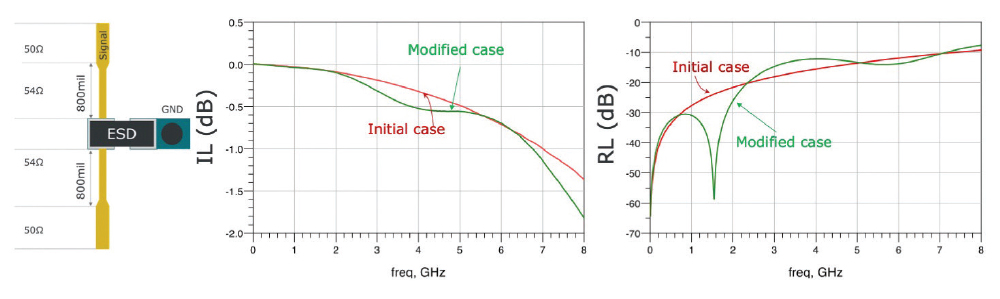
However, it should be mentioned that for some PCB technologies with higher manufacturing tolerances, the impedance range can be violated by introducing this method. In addition, this method works only when the rise time of the TDR signal is not too short. In this case, a rise time of 100 ps was used. For much shorter rise times with greater resolution, this method might deliver expected results. The length of the trace should be not too long which would lead to additional reflections and limiting the link performance.